BeInCrypto analyzes the price movements for seven different cryptocurrencies, including XRP, which has made numerous attempts at breaking out from a descending resistance line.
BTC
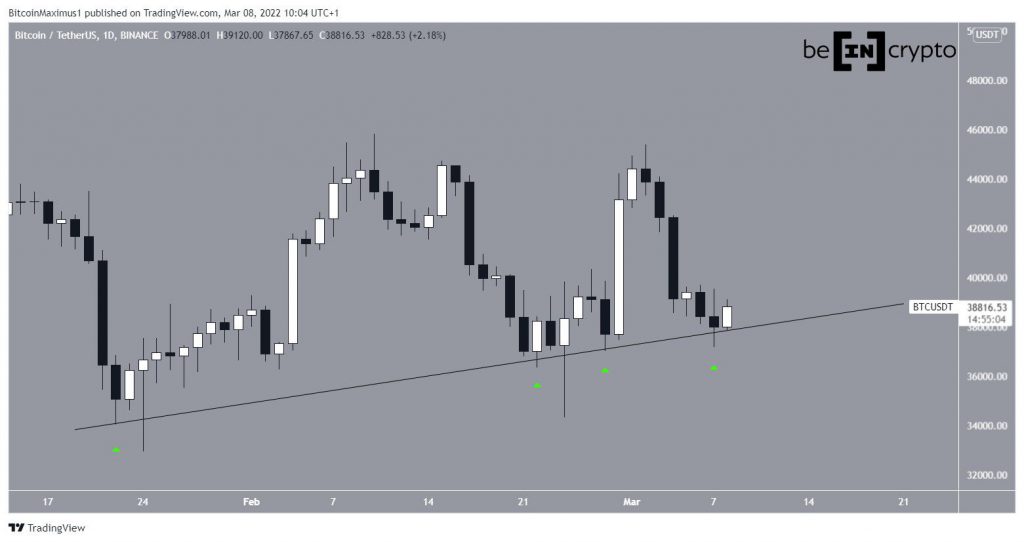
BTC has been increasing above an ascending support line since Jan. 24. So far, the line has been validated four times (green icons), most recently on March 7. In addition to this, BTC briefly broke down from the line twice before reclaiming it.
As long as the support line remains intact, the short-term trend could still be considered bullish. However, considering each touch weakens the support line, an eventual breakdown could also occur.
ETH
ETH has been trading inside an ascending parallel channel since Jan. 24. The midline of the channel has acted as resistance multiple times (red icons), most recently on Feb. 25.
On Feb. 28, ETH reclaimed the midline and appeared to be in the process of validating it as support.
However, the price broke down on March 2 (green circle) and has been decreasing since. It’s currently approaching the support line of the channel and wick support from Feb. 24 (green icon).
XRP
XRP has been decreasing underneath a descending resistance line since Feb. 8. The line has now been validated six times (red icons), most recently on March 7.
Since resistances get weaker each time they are touched, an eventual breakout from this line seems to be the most likely scenario.
If a breakout occurs, the next closest resistance area would be found between $0.77-$0.80. This target range is the 0.5-0.618 Fib retracement resistance area.
ZEN
ZEN has been trapped under a descending resistance line since Feb. 7. The line has been validated three times thus far (red icons), most recently on March 3.
In addition to this, ZEN has deviated below the $30.50 horizontal support area (red circle) for a short time before reclaiming it.
On March 7, it created a higher low and is now in the process of moving towards the resistance line once again.
SOL
SOL has been trading inside a descending wedge pattern since Jan. 24. The wedge is often considered a bullish pattern, meaning that a breakout above it would be likely.
Furthermore, both the RSI and MACD have generated bullish divergences (green line).
If SOL breaks out, the first resistance area to contend with would be found near $105.
AVAX
AVAX had been increasing above an ascending support line since Jan. 22 but broke down from the line on Feb. 20 and validated it as resistance on March 1 (red icon). The price has been moving downward since.
The closest support area is found at $66.
FTT
In the period between March 5 – 9, FTT has been consolidating above the $39 support area. During this time, both the RSI and MACD generated bullish divergence, which often precedes upward movements. FTT has been increasing since March 7.
If the upward movement continues, the closest resistance area would be between $43.20 – $44.20. This is the 0.5 – 0.618 Fib retracement resistance region.
For BeInCrypto’s latest Bitcoin (BTC) analysis, click here
Disclaimer
All the information contained on our website is published in good faith and for general information purposes only. Any action the reader takes upon the information found on our website is strictly at their own risk.


