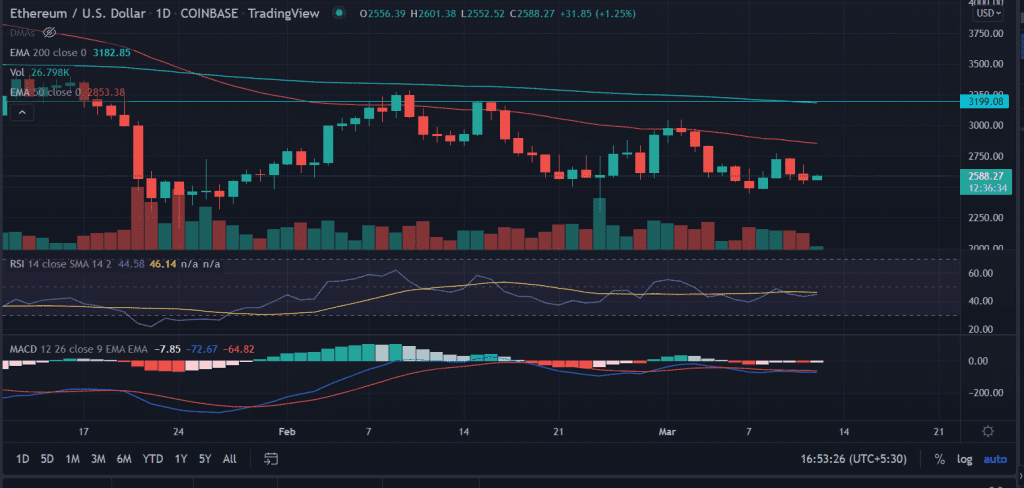
Ethereum price action trades with modest gains on Saturday. The price manages to recover from the lows of $2,552.25 after two consecutive sessions of fall. ETH is moving in a sideways manner since late January.
- Ethereum price remains sideways with no meaningful price action.
- Expect more gains toward $3,200 above a decisive close of 50-day and 200-day EMAs.
- The Momentum oscillators remain neutral warns of aggressive bids.
As of publication time, ETH/USD is trading at $2,587.56, up 1.21% for the day. The second-largest cryptocurrency by market cap holds 24-hour trading volume at $10,529,639,128 with more than 8% losses.
Ethereum price looks for an upside reversal
On the daily chart, Ethereum’s price surged 55% after testing the lows of $2159.00 on January 24 and made swing highs at $3,284.75. However, investors are not convinced or willing to sustain the gains and fell to lows of $2,300 in February with few hiccups in between.
It is interesting to watch how sellers react near the vital $2,500 level for the short time. Ethereum price tested the support level thrice since the end of January thus making it a crucial level to trade.
Now, the renewed buying pressure will push Ethereum’s price to test many upside hurdles before tagging the ultimate target at $3,200.
A green candlestick on the daily chart could first meet the 50-day Exponential Moving Average (EMA) at $2,853.23. Next, market participants will move higher to take out the crucial 200-EMA at $3,200.
On the flip side, a spike in sell order might result in violating the $,2500 reliable support level. On the downside, sellers will collect the liquidity at the demand zone extending from $2,300, and $2,159.0.
Technical indicators:
RSI: The daily Relative Strength Index is trading neutral while oscillating near the average line. Any uptick in the indicator could push the price higher.
MACD: The Moving Average Convergence Divergence is hovering below the midline since February 19 with no meaningful price action.


