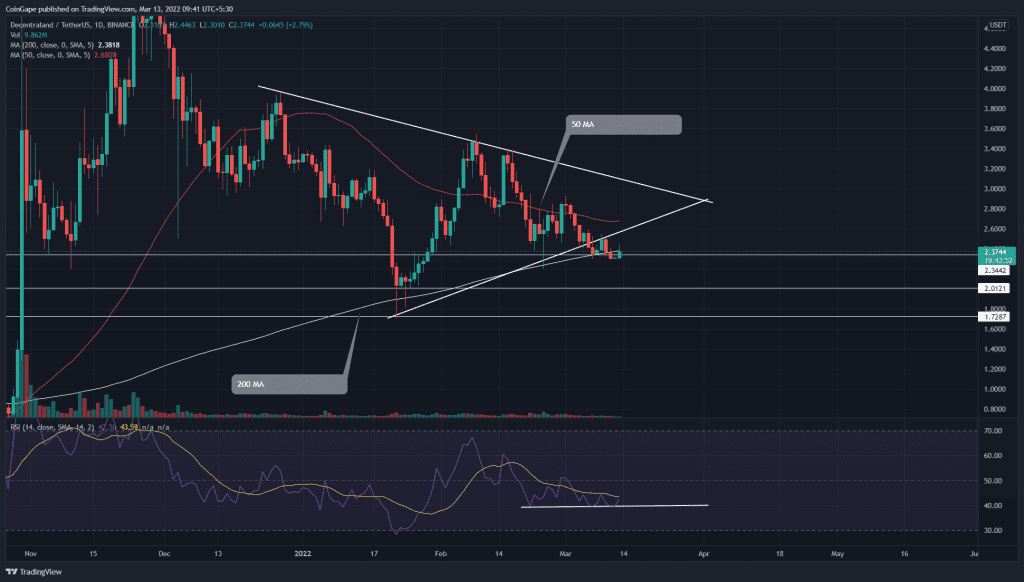
A bearish breakdown from the ascending trendline indicates the continuation pattern has resulted in favor of MANA sellers. In addition, the retest phase validated the prior support trendline has flipped to resistance. Can traders sustain the bearish momentum to reach the January bottom support($2)?
Key points:
- The MANA chart shows a post-retest bearish trend continuation
- The MANA buyers trying to reclaim the 200-day MA
- The 24-hour trading volume in the Decentraland token is $408 Million, indicating a 34.5% gain.
Source-Tradingview
On March 6th, the Decentraland(MANA) price gave a bearish breakout of the symmetrical triangle pattern. The altcoin spent the next three days retesting the breached support trendline. The renewed selling has dumped the altcoin below the $2.34 and 200-day MA.
If the sellers retain trend control, the traders can expect a 15% freefall, hitting the $2 psychological level, followed by a $1.71
In contrast to the bearish thesis, if buyers pushed the altcoin above the 200–day MA, the price could attempt to enter the triangle pattern, indicating the current breakdown was a bear trap.
Currently, the MANA price exchanges hand at $2.38, with an intraday gain of 3.32%.
Technical indicator
The MANA price trading below the daily-MA line(20, 50, 100, and 200) maintains a bearish tendency. Moreover, the sellers have recently reclaimed the 200-day MA, providing an extra edge to short-sellers.
The Supertrend indicator maintains a negative bias in the daily time frame chart.
Despite a lower low formation in price action, the RSI indicator slope maintains its low at 40%. This indicates weakness in selling momentum, bolstering buyers to wrest control from them.
Resistance level: $2.83 , $3.48
Support level: $2.4, $2


