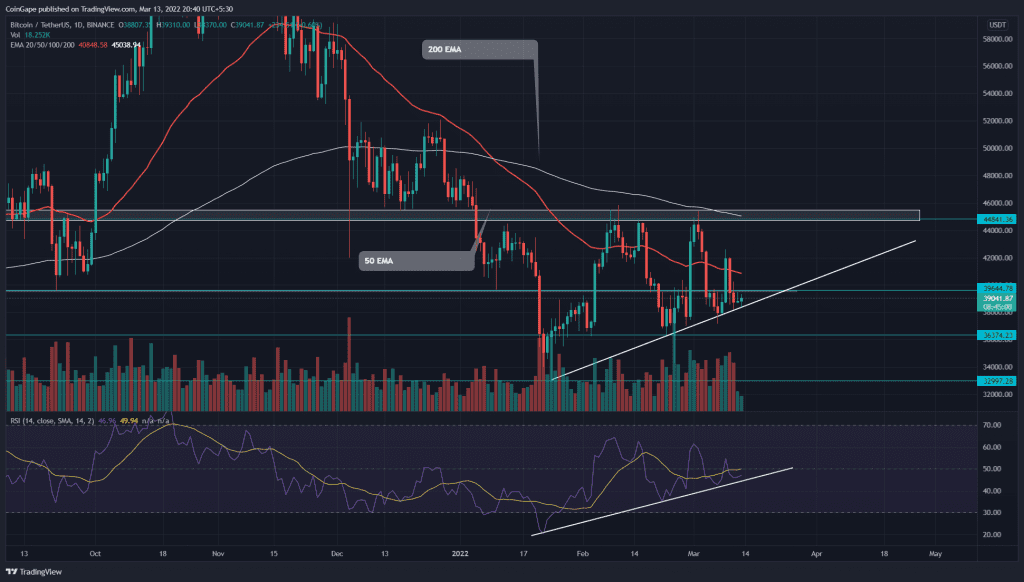
The Bitcoin price forming a Doji candle suggests indecision in the market. The recent bear cycle has dumped the coin price to the bottom support trendline($38283), hoping to restock the bullish momentum. However, the buyers struggling to breach the immediate resistance of $45000 threatens the ascending triangle fallout.
Key points
- The BTC price retests the dynamic support trendline.
- The intraday trading volume in Bitcoin is $16.3 Billion, indicating a 12.7% loss.
Source- Tradingview
Over the past two months, the Bitcoin(BTC) price has resonated between a stiff resistance of $45000 and an ascending trendline. This range-bound rally has revealed the formation of an ascending triangle, indicating the price would eventually breach this formidable resistance.
On March 8th, the buyer’s price attempted to rebound from the dynamic trendline and gave a massive bullish breakout from the $40000 resistance on March 9th. However, the bull cycle couldn’t sustain above the breached resistance, and on the following day, the price plunged below it.
The BTC price has traded inside a very tight range in the last two days, stretching from the $40000 and a rising trendline. Therefore, the traders can consider this area as no-trading and wait for a genuine breakout before entering a new position.
If buyers could breakout and close above the shared resistance of $40000 and 20-day EMA, the bullish rally would drive the altcoin by 13% rechallenge the $45000 resistance.
Conversely, a bearish breakdown from the support trendline would signal the continuation of the downtrend and plunge the altcoin 15% down to retest the January low($33000).
- Resistance level- $39640, $44650
- Support level- $36372, $30000
Technical Analysis
In a bearish sequence, the flattish crucial EMAs(20, 50, 100, and 200) indicate the path to least resistance is downward. The Relative Strength index slope following a similar structure as BTC price action accentuates a range-bound rally.


