LUNA price extend the previous session gains and started the fresh trading week on a higher note. Although the price faces some upside pressure at the session’s high the downside risk seems limited for the asset.
- LUNA price edges higher on Monday with remarkable gains.
- A decisive close above $95.0 aims for an all-time high next.
- Downside risk remains limited at $85.0.
As of publication time, LUNA/ USD is exchanging hands at $92.61, up 5.96% for the day. The seventh-largest cryptocurrency by market cap holds 24-hour trading volume at $3,425,875,156 with more than 83% gains as per the CoinMarketCap.
Generally, a rise in price with increased trading volume is a sign of strength in the price.
LUNA price moves north
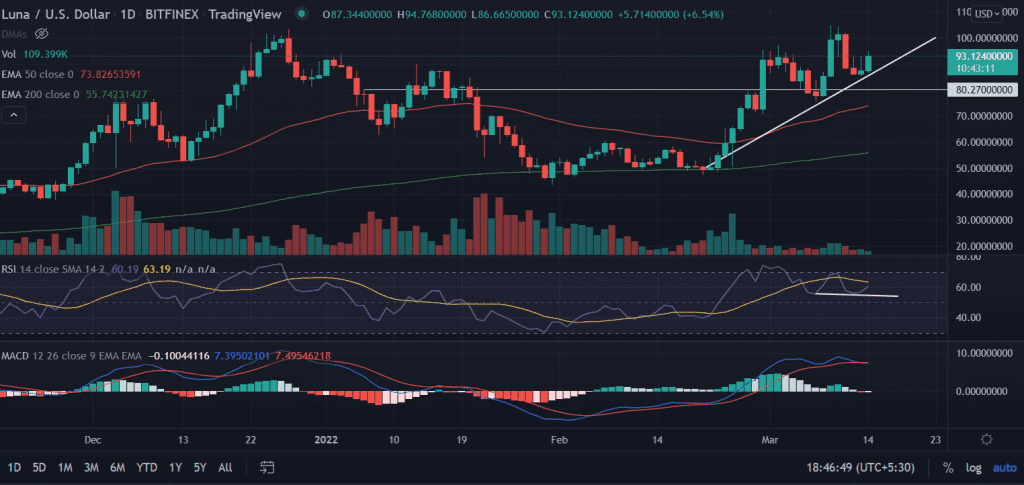
On the daily chart, LUNA price is rising along the ascending trendline, which is extending from the lows of $50.71 that also coincides with the critical-200 EMA (Exponential Moving Average) at $49.65. Further, the asset pierced another crucial hurdle of 50-day EMA at $50.67. LUNA price surged more than 100% since February 20 bucking the broader crypto market trend.
Currently, LUNA’s price is facing some upside barrier near the $93.0-$95.0 zone. A resurgence in the buying pressure would push the price toward higher territories aiming for the first target at all-time highs of $104.57.
Next, an extended buying momentum will attempt to test the next all-time-high level at the psychological $110.0 barrier.
On the flip side, a break of the bullish slop line will invalidate the bullish theory. On the downside LUNA price dive toward the $80.0 horizontal support level. Below that sellers will further collect the liquidity around the $70.0 demand zone.
Technical indicators:
RSI: The Daily Relative Strength index is giving negative divergence and trades below the average line. Any downtick in the indicator could push the price lower.
MACD: The Moving Average Convergence Divergence (MACD) is oscillating above the midline with a neutral bias.


