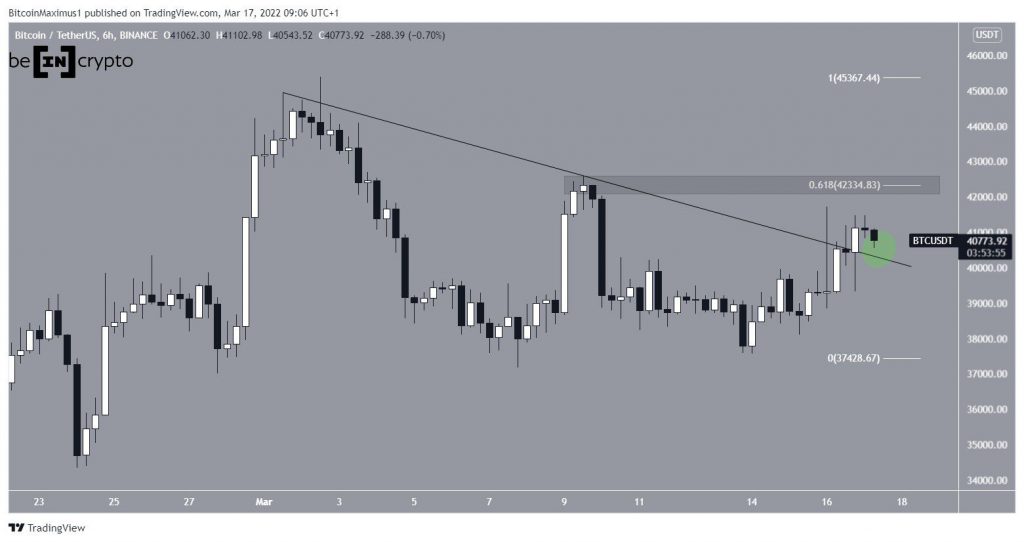
Bitcoin (BTC) has increased considerably since March 14 and reclaimed both a horizontal and diagonal short-term resistance level on March 16.
Since March 1, Bitcoin had been decreasing underneath a descending resistance line. This resistance rejected the price on March 13, leaving behind a long upper wick. Such wicks are considered signs of selling pressure.
However, BTC regained its footing and managed to break out the next day. Currently, it’s in the process of validating the line as support (green circle). If successful, this would likely lead to the continuation of the upward movement.
The next closest resistance area is found at $42,335. This is both the 0.618 Fib retracement resistance level and a horizontal resistance area. Due to this confluence, it’s a very important level to watch.
Short-term BTC reclamation
The two-hour chart provides a decisively bullish outlook.
BTC has reclaimed the $39,830 horizontal support area, validating it as support and creating a long lower wick in the process. It has also broken out from an ascending parallel channel and is in the process of validating its resistance line as support (green icon).
These signs suggest that the BTC price action is bullish and higher prices are likely on the horizon.
In addition to this, both the RSI and MACD are increasing. This indicates that momentum is bullish and supports the continuation of the upward trend.
Future movement
The daily chart shows that BTC has been trading above an ascending support line since Jan. 22. The line has been validated numerous times (green icons), most recently on March 14. At the time, BTC created a bullish engulfing candlestick and began the ongoing upward move.
It’s possible that the price is also trading under a descending resistance line (dashed) but the line hasn’t been validated enough times yet.
The resistance line is currently near $42,800. If validated once more, it would create a symmetrical triangle. Since the triangle is considered a neutral pattern, either a breakout above resistance or a breakdown below the ascending support line would be required in order to confirm the direction of the trend.
For BeInCrypto’s previous Bitcoin (BTC) analysis, click here
Disclaimer
All the information contained on our website is published in good faith and for general information purposes only. Any action the reader takes upon the information found on our website is strictly at their own risk.


