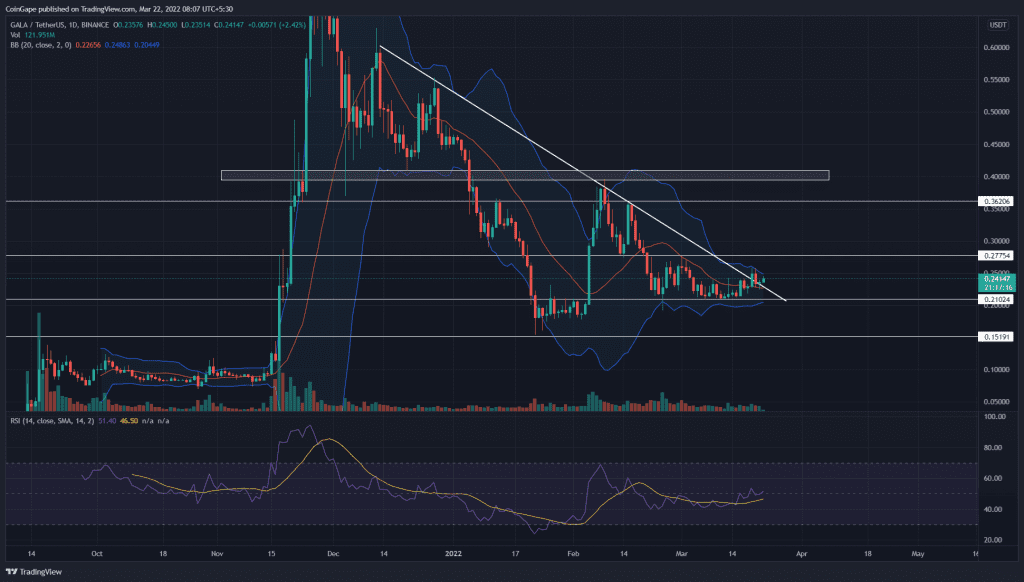
Following the hammer candle on Monday, the GALA/USDT pair goes green today, displaying a 2.5% intraday gain. The sustained buying should allow traders to rechallenge the local resistance at $0.27, opening the path to the February high($0.4) mark.
Key points:
- The GALA price forming a morning star candle for descending trendline retest
- The intraday trading volume in the GALA is $719.4 Million indicating a 9.34% loss.
Source- Tradingview
For the past three months, the GALA sellers have been very responsive during the downtrend rallies, allowing short sellers to enter new positions. The recent bear cycle dumped the altcoin to the $0.21 mark, displaying a 45% loss from the February high($0.362).
The buyers bounced back from this support with a morning star candle but failed to surpass the flipped resistance of the $0.277 mark. Despite a sluggish price action, the GALA price gave a bullish breakout from the descending trendline on March 19th, providing the first signal to recovery.
The breakout candle tagged the 50-day EMA and turned down to retest the breached resistance. The morning star candle formation at retest suggests prior resistance has switched to support.
The potential rally could spike 65%, hitting the $0.4 mark.
Conversely, if the altcoin slips below the descending trendline, it would indicate the .current breakout was a bear trap, and coin price could sink to the January low of $0.15
Technical Indicator
Contrary to GALA price action, the RSI indicator slope(48) makes higher highs, suggesting the buyers strengthen their grip.
The Bollinger band range narrowing emphasizes the short-range in GALA price. Furthermore, the altcoin reverted from the upper band and slumped to the midline. This neutral level could bolster the buyers to rebound from the $0.23 support.
- resistance level- $0.27, and $0.36
- Support level- $0.21 and $0.15


