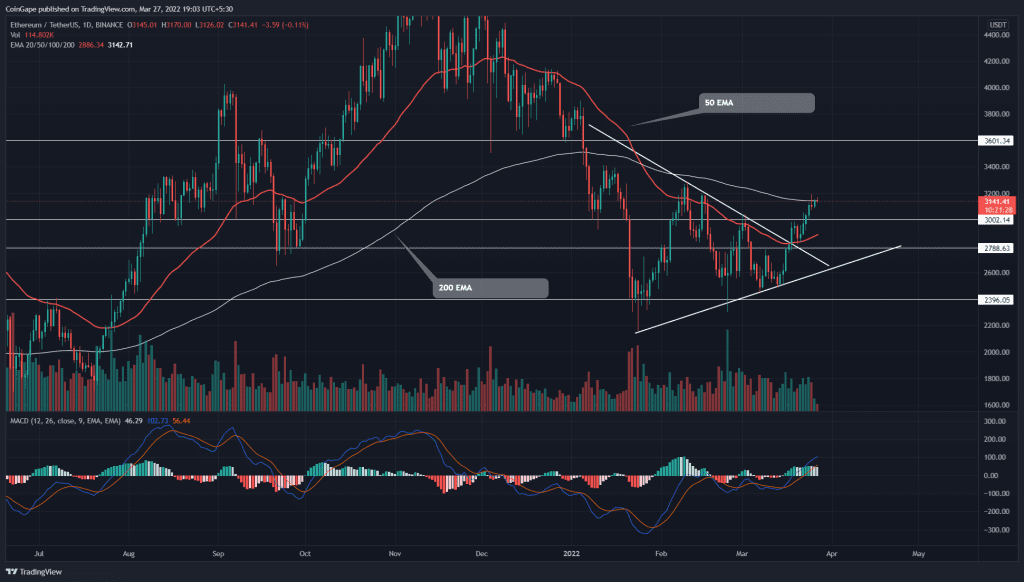
The symmetrical triangle breakout kick starts a new Ethereum(ETH) price recovery. The buyers have surged the altcoin by 12.5%, hitting the $3200 mark. However, the 200-day EMA prevents any further price rally, suggesting a minor pullback is needed before the bull run could continue.
Key points:
- The ETH chart shows rejection at $3200 resistance.
- The intraday trading volume in Ether is $9.11 Billion, indicating a 16.26% loss.
Source- Tradingview
The two-month consolidation phase in Ether price favored the bulls with a bullish breakout from the descending trendline of the symmetrical triangle. The post retest rally initiated a four consecutive green candle which pumped the altcoin by 11.26%.
The second-largest cryptocurrency traders at the $3144 mark displayed higher price rejection at 200-day EMA. If sellers revert the coin price from this EMA resistance, the minor pullback can find solid support of $3000.
This dip opportunity could bring more long traders into the market, suggesting their next target at $3600.
Best optionsEarnEarn 20% APRClaim5 BTC + 200 Free SpinsWalletCold Wallet
Conversely, if sellers slip the altcoin below the $3000 mark, the resulting downfall could meet the support trendline.
On-chain metric-Global In/Out of the Money

- The GIOM metric shows 75.77% are ‘In The Money’ and experiencing profit. On the flip side, 20.02% of holders are at the money projects.
- The nearest green cluster shows possible support at $2884, followed by $2456. Moreover, the next red cluster indicates the demand zone $3332 and later $3796.
Technical Indicator
- The 200-day EMA line restricts buyers from rallying beyond the $3200 mark. On the other hand, the recently flipped 50-day EMA should assist in forming the dip support.
- The MACD indicator escapes its own consolidation below the neutral zone and reenters the bullish territory. A significant spread between the MACD and signal shows sustain buying from traders.


