Disclaimer: The findings of the following analysis are the sole opinions of the writer and should not be considered investment advice
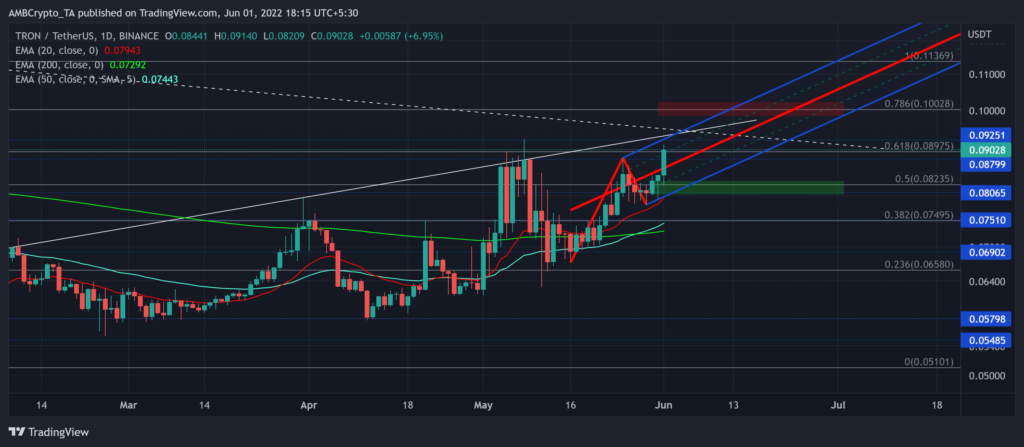
After taking off from the $0.057-support, Tron (TRX) has made impressive progress on its chart over the past seven weeks.
Higher lows alongside steady highs beyond the 38.2% and 50% Fibonacci levels bagged in well-desired gains while outperforming major cryptos amidst the recent crash.
A host of barriers around the $0.089-zone could fuel a near-term slowdown before the bulls aim to find renewed pressure to overturn the 61.8%-level.
The ripple effect of massive capital inflows recently could help bulls snap the $0.092-resistance in the coming days. At press time, TRX was trading at $0.09028, up by 10.88% in the last 24 hours.
TRX Daily Chart
TRX has disagreed with the broader market sentiment for over four months now. While its peers were struggling to pick themselves up from the ashes of their record lows, the altcoin has been reclaiming vital price points.
The 33% gains over the last 20 days have led the alt to retest the 61.8%-level for the second time over the last month. However, over this timeframe, the volumes have marked a gradual decline in their trend.
A potential reversal from the 61.8%-level would expose the alt to a near-term setback towards the lower trendline (blue) of the Pitchfork.
On a rather brighter side, the 20 EMA (red) and the 50 EMA (cyan) undertook a bullish crossover with the 200 EMA (green) to depict strong buying momentum in the market.
Thus, the $0.08-level could provide reliable grounds for the short-term correction to bounce back. In this case, sustained recovery beyond the $0.092-mark would finally pave the way towards $0.1.
Rationale
The RSI’s progression has been quite decent while the bulls claimed an edge in the current narrative. Any reversal from the 65-mark could affirm the possibility of a short-term setback on the chart.
The OBV confirmed the decreasing trend in volumes over the last few weeks and bearishly diverged with the price. On the other hand, the CMF continued its north-bound journey beyond the zero-mark and confirmed increasing capital inflows.
Conclusion
Given the 61.8% resistance standing steady alongside a bearish divergence on the OBV, near-term setbacks could find a cushion around the $0.08-level.
A continued bullish revival from near the 20 EMA would present a buying opportunity. A close above the $0.092-level could be an entry trigger.
Finally, investors/traders should consider Bitcoin’s movement and its near-term impact on broader market perception to make a profitable move.


