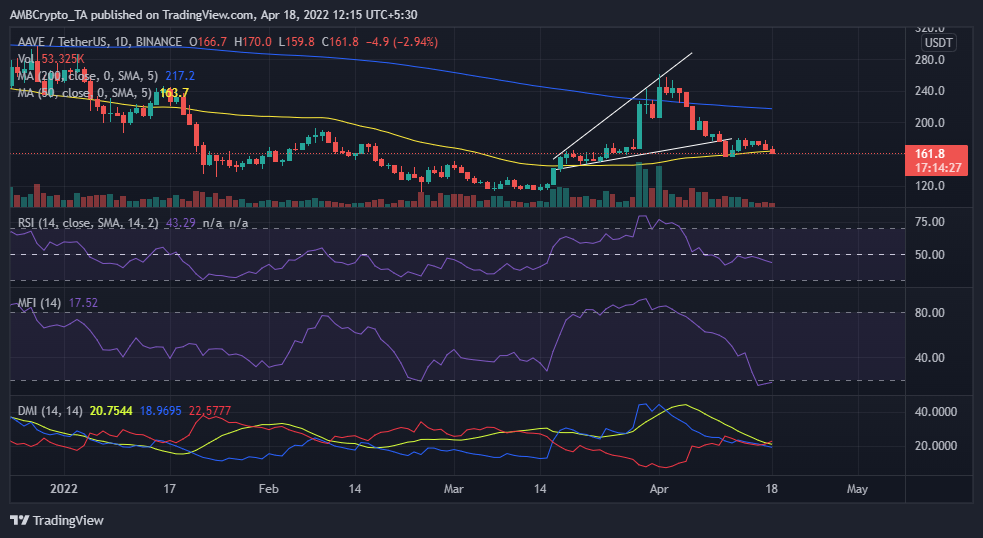
AAVE’s price action recently broke through its ascending support which was part of its megaphone pattern. The bearish performance was part of its correction after its March rally and it has so far registered horizontal price movement in the last few days.
AAVE traded at $161 at the time of this press as it continued to seek more downside. Its current price point is a significant discount from its recent local top at $261, but is notably higher than its Q1 2022 lows. It also hovered above its 50-day moving average as the price continues to yield to bears due to lack of significant bullish momentum.
Is AAVE about to turn bullish?
AAVE’s RSI is currently hovering below the neutral zone but not yet oversold, while its MFI is currently is showing recovery from below 20. The latter is considered an accumulation zone and a potential sign that the bulls might be about to take over. Meanwhile, the DMI is currently showing signs of change in trend direction.
The bullish reversal expectation are further enforced by some of AAVE’s on-chain-metrics. For example, its 30-day MVRV ratio is currently at -14.2%, which means many of AAVE’s investors are still in the red. It aligns with the volume which recently dropped to the lowest monthly levels at around $109.87 million. The last time that AAVE registered such low volumes was when at the start of its March rally.
AAVE’s market cap dropped from $2.35 billion to $2.28 billion within the last 24 hours. Its volume registered a slight uptick within the same period. AAVE’s price is expected to encounter support within the $152 price level if it maintains its current trajectory.
In conclusion, AAVE’s current price action, indicators and on-chain metrics highlight the increased probability of a bullish reversal. However, the overall market conditions continue to side with the bears, hence continued bearish performance.


