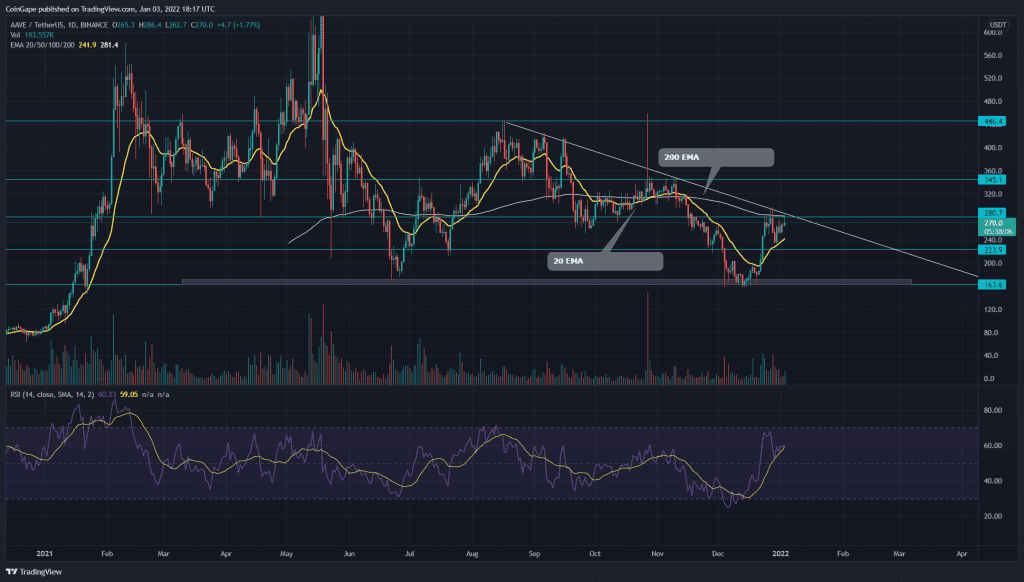
For more than six months, the AAVE token price has been resonating between the $450 and $160 mark, indicating a sideways rally. Its recent recovery from the latter half of December 2021 surged 75% to the $280 resistance. However, the major technical acting as resistance could dumb the price back to $160 support.
Source- Tradingview
Past Performance in AAVE token chart
In September 2021, the token initiated a retracement phase from the $420 resistance zone, aiming for the bottom support near $160. A descending trendline leads this short-term downtrend by acting as a dynamic resistance level.
On December 15th, the pair plunged to the $160 support, indicating a 64% loss from the top resistance of the range. The token experience intense demand pressure from this support resulted in a quick recovery to the $280 mark.
AAVE Token Displays A Rounding Bottom Pattern.

Source- Tradingview
The AAVE token price is currently struggling to overcome the $280 mark. A confluence of the resistance trendline and 200 EMA indicate this level as a strong area of interest that would require a significant amount of buying pressure to make a breakout. However, the technical chart shows several higher price rejection candles at this resistance, suggesting another possible bearish reversal.
On a contrary note, the 4-hour time frame chart shows the formation of a cup and handle pattern. This pattern could help the price breach the descending trendline, providing an excellent long signal that could climb to the $446 mark.
By the press time, the AAVE token is trading at $278.5, with an intraday gain of 3.51%. The 24hr volume change is $540.7 Million, indicating an 86.5% hike. According to Coinmarketcap, the token stands at 46th rank with its current market cap of $3.69 Billion(+5.78).
Technical Indicators-
-The daily Relative Strength Index(60) shows impressive recovery in its chart, crossing above the neutral line and 20-SMA.
– The sideways trend in the AAVE token has flattened the crucial (100 and 200 EMA). Moreover, the price is still trading below the 200 EMA, indicating a bearish trend for this token. However, the recent rally has filled the dynamic resistance into possible support.
-The traditional pivot shows remarkable confluence with the daily AAVE/USD chart level. According to these pivot levels, the crypto traders can expect the nearest resistance at $298, followed by $330. As for the opposite end, the support levels are $265 and $230.


