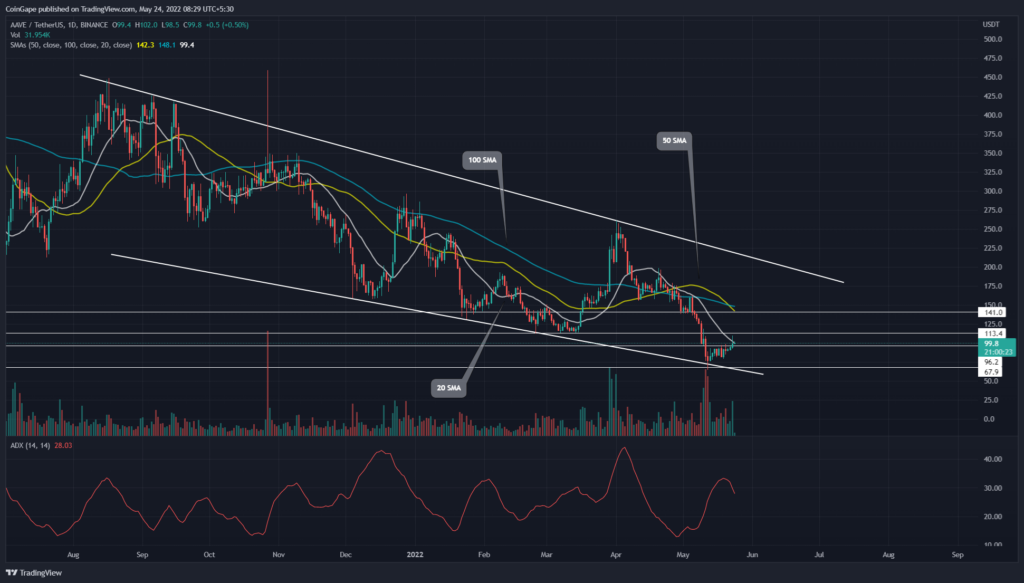
AAVE/USDT pair has been lowering within a falling parallel channel pattern for the past nine months. The last bear cycle initiated from the $260 mark discounted the altcoin by 72% as it hit the support trendline. Can this bottom support replenish the bullish momentum for a bullish recovery?
Key technical points:
- The AAVE price aim $115 breakout
- The 50- and 100-day SMAs project a bearish crossover
- The intraday trading volume in AAVE/USD is $339 Million, indicating a 138% gain
Source- Tradingview
On April 5th, the AAVE price turned down from the downsloping resistance trendline of the falling channel pattern. The resulting V top reversal plunged the altcoin to a $150 psychological level, which stalled the ongoing downfall for a week.
However, the buyers eventually submitted to the growing selling pressure and breached this support on April 30th. The post-retest fall and widespread bearish sentiment in the crypto market tumbled the AAVE price 53% lower to hit the bottom support trendline.
This completed the last bear cycle inside the channel pattern, and now it’s buyers’ turn to shine. Thus, the AAVE price rebounded from the support trendline and surged 42% higher.
Trending Stories
The AAVE price currently trades at $101 and may soon challenge the immediate resistance of $115, preparing for a bullish breakout. If the buyer succeeds, the altcoin will experience a 30% pump.
advertisement
On a contrary note, the higher price rejection candle at $100 keeps a fakeout possibility on the cards, which may slump the price back to $70.
Technical Indicator
SMA- The crucial SMAs(20, 50, 100, and 200) assist sellers in limiting the AAVE price recovery as it currently faces supply pressure at the 20-day SMA. Moreover, a bearish crossover of the 50-and-100-day SMA would lure more sellers into the market.
However, The daily-ADX slope took a U-turn from 33.6%, suggesting a significant loss of bearish momentum.
- Resistance levels: $115 and $137
- Support levels: $96 and $80


