Published 41 mins ago
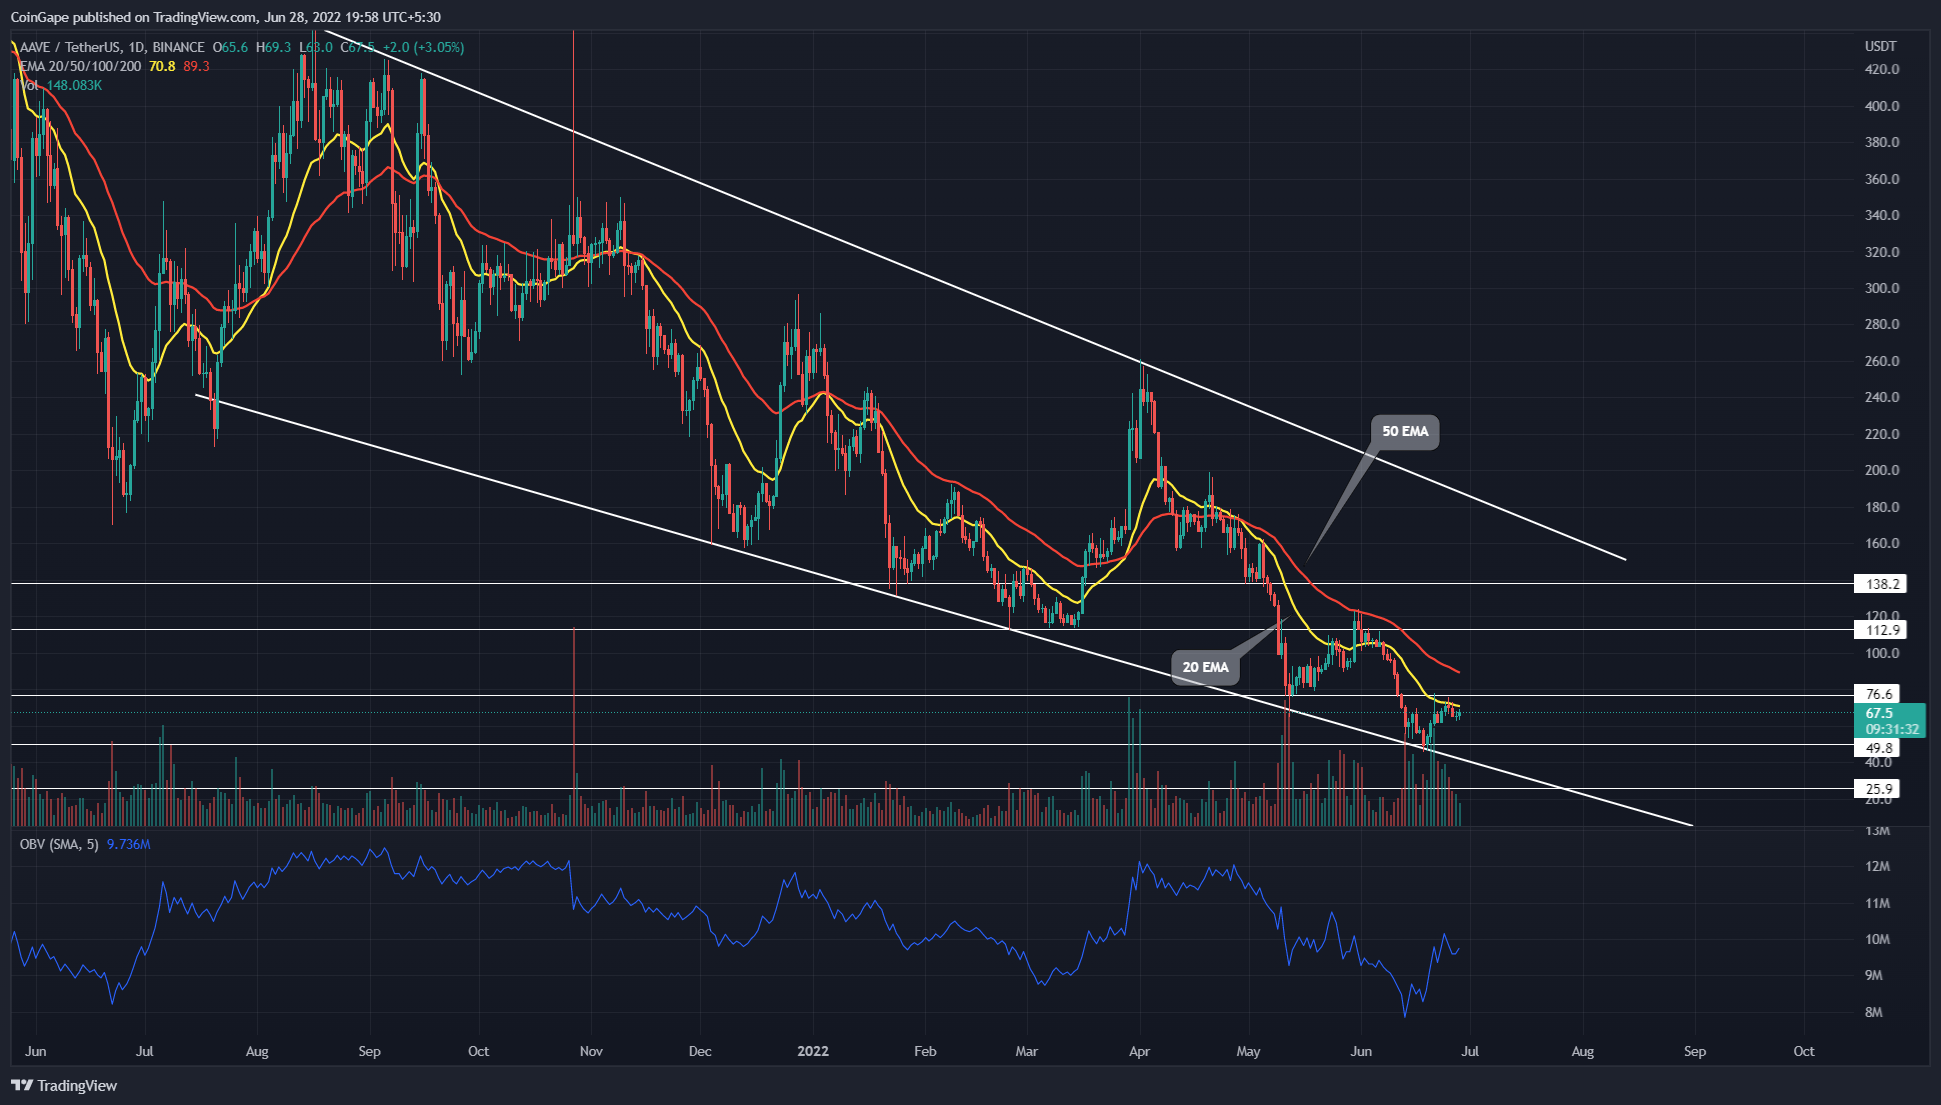
The AAVE price has been resonating in a falling channel pattern for nearly a year now. Historically, when the coin price has fallen to the bottom support trendline, the coin chart displays a recovery rally of more than 50% or more till it reaches the overhead trendline. Thus, the altcoin has again reverted from the support trendline, indicating a recovery opportunity for traders.
advertisement
Key points:
- The rising OBV indicator slope encourages coin buyers to breach the $76.6 resistance.
- The $76.6 breakout may drive the AAVE price 46% higher to the $112 mark.
- The intraday trading volume in AAVE/USD is $134.3 Million, indicating a 15% gain.

Source- Tradingview
A falling parallel channel pattern reflects the AAVE/USDT pair downtrend since mid-August 2021. Moreover, the coin price has retested on the descending trendlines multiple times, validating the pattern is active and could affect the upcoming rally.
Amid the June second-week sell-off, the AAVE price plummeted to the combined support of a descending trendline and $50. While the crypto market witnessed a widespread recovery last week, the altcoin surged 54.8% higher and hit the $76.6 resistance.
Trending Stories
However, over the past eight days, the AAVE chart shows several long-wick rejection candles at overhead resistance, suggesting the sellers are aggressively defending this level. Thus, if the altcoin continues to sustain below this resistance, the sellers may pull the price 28% lower to the 50-$48 support zone.
Conversely, a possible breakout from the $76.6 resistance could trigger another bull cycle within the falling channel. The resulting recovery could rise to overhead resistance.
advertisement
Technical indicator
The OBV indicator showed exceptional growth in response to the recent price jump, bolstering the breakout theory from the $76.6
advertisement
However, since the April-May sell-off, the AAVE price has experienced dynamic resistance from the 20-and-50-day EMAs. Currently, the 20 EMA aligned with the $76.6 chart level puts additional selling pressure on coin traders.
- Resistance levels: $76.6 and $11
- Support levels: $50 and $26
Share this article on:
The presented content may include the personal opinion of the author and is subject to market condition. Do your market research before investing in cryptocurrencies. The author or the publication does not hold any responsibility for your personal financial loss.


