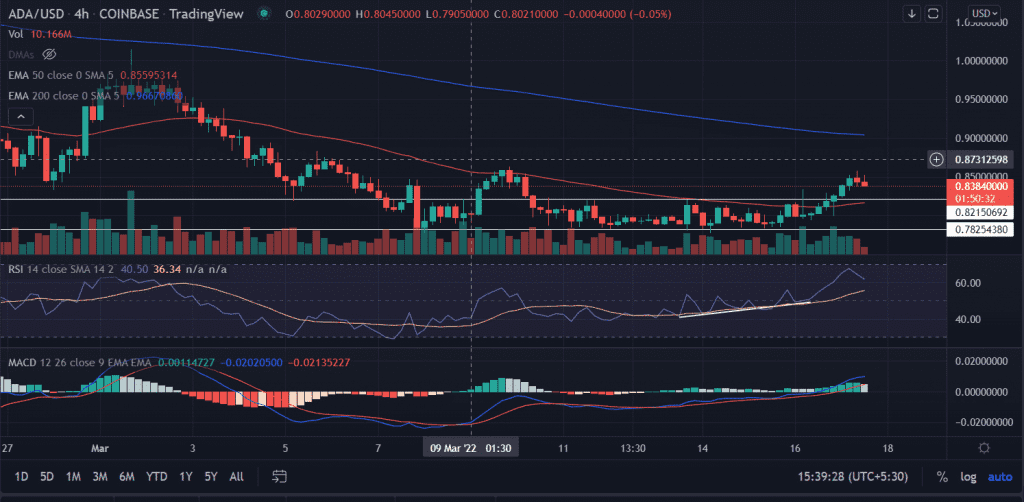
ADA price trades with a positive bias on Thursday. After opening higher Cardano (ADA) price sustain the momentum and managed to break out the short-term resistance placed at $0.85
- ADA price trades with modest gains.
- A breakout above $0.85 hints at more gains towards $0.95.
- The momentum oscillators look favorable to upside momentum.
ADA price attempts upside breakout
On the four-chart, ADA price completes a ‘Round’ bottom formation. The technical pattern is generally formed in a long-term downward trend. Sellers become exhaustive and look for signs of reversal as the lows are in a very tight range.
Looking at the current price action, the lows kept bounded in the range of $0.75-$0.78 since March 10. Furthermore, the upside capped around $0.80-$0.82. In today’s session, finally, ADA price broke the short-term range as it tests the psychological $0.85 level.
Now, it is interesting to watch if bulls are able to sustain the upside momentum. The recent upsurge also coincides with the crossing of the 50-day SMA (Simple Moving Average) at $0.81. The move is further supported by the above an average volume. This sums up the reliable upside breakout of the trading range.
A sustained buying pressure will first target the crucial $0.90 horizontal resistance level. This will also coincide with the breaching of the 200-day EMA (Exponential Moving Average).
Next, bulls will attempt to take out the ultimate target of $0.95.
On the other hand, a break below the 50-day SMA will invalidate the bullish outlook for the asset. As again ADA price will fall into the familiar trading range with a downside at $0.75.
Technical indicators:
RSI: The 4-hour Relative Strength Index widens above the average line with a strong bullish bias. It reads at 61.
MACD: The Moving Average Convergence Divergence moves above the midline with an upward bias.
As of publication, ADA/USD is trading at $0.84, up 0.29%. The 24-hour trading volume of eight-largest cryptocurrency holds at $1,204,710,421 as per the CoinMarketCap data.


