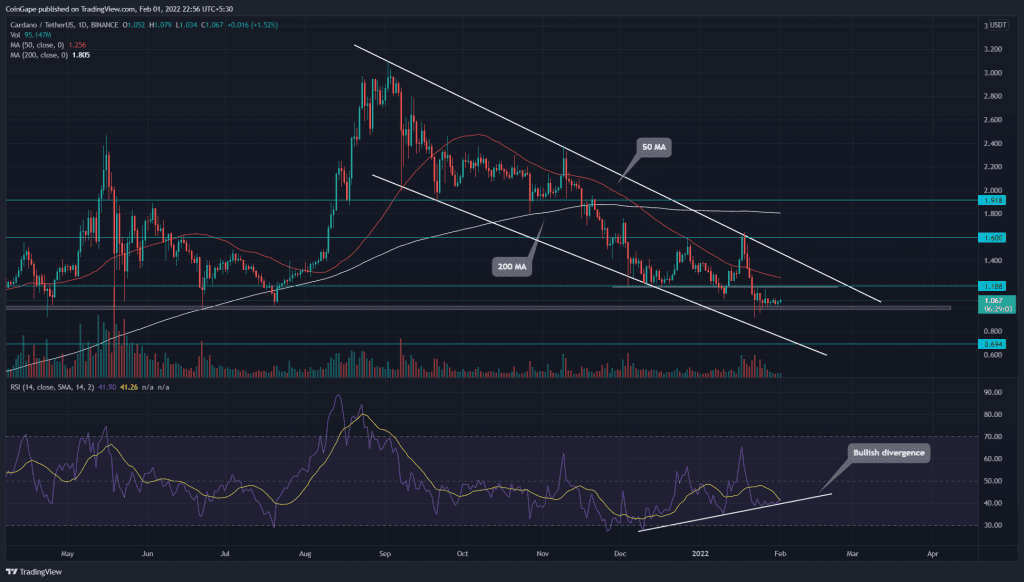
The overall trend for ADA price will remain bearish until the falling parallel channel is intact. ADA price recently provided a V-top rejecting from the descending trendline, which plunged the alt to $1 crucial support. The buyers are making strong efforts to sustain above this bottom support and eventually initiate a new rally.
Key technical points:
- The daily-RSI bullish divergence hints a rise in underlying bullish momentum.
- The intraday trading volume in the ADA coin is $1.08 Billion, indicating a 14.37% gain.
Source- Tradingview
As mentioned in our previous coverage of Cardano price analysis, the ADA bulls failed to sustain the price above the $1.5 mark, which resulted in a free fall to the 1$ crucial support. However, the bulls are strongly defending this support, displaying several lower price rejection candles.
Furthermore, the daily chart shows the alt is falling under the influence of a falling parallel channel. If the sellers drop the coin below the $1 support, the ADA price is likely to slide 30% to the $0.7 mark.
Analyzing the crucial MAs, we observe a bearish alignment in the daily chart. Moreover, the downsloping of the 20, 50, and 100 MA indicates the bears are dominating.
However, the Relative Strength Index shows an evident bullish divergence concerning the last three lower lows in price action. The rising RSI slope indicates the increasing strength in buyers.
ADA Price Resonates In A Narrow Range

Source- Tradingview
For the past week, the ADA price has been wobbling between $1.17 and $1. The constant tug of war between the bulls and bears inside this tight range has created a no-trading range. A breakout from either level of this range would suggest the first signal for the respective rally.
- Resistance levels- $1.17 and $1.5
- Support levels- $1 and $0.7


