Algorand (ALGO) increased significantly on May 3, but has yet to reclaim the $0.70 minor resistance area and the midpoint of its current pattern.
ALGO has been falling since reaching an all-time high price of $2.99 on Nov. 18, 2021.
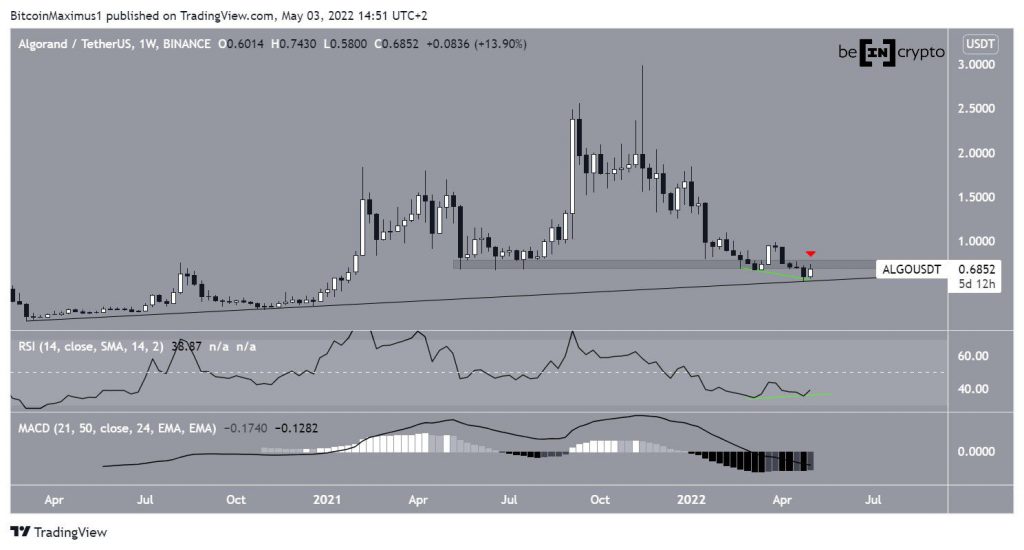
Initially, the price bounced above the $0.75 horizontal support area in March 2022. However, after a brief bounce, ALGO broke down the next month. This was a crucial development since this area had been acting as support since May 2021.
Despite the breakdown, the price managed to bounce at a long-term ascending support line, which has been in place since April 2020.
Technical indicators in the weekly time frame provide mixed readings. While both the MACD and RSI are falling, the latter has generated bullish divergence (green line).
Due to these mixed signs, the trend cannot be considered bullish until ALGO manages to reclaim the $0.75 area.
Short-term parallel channel
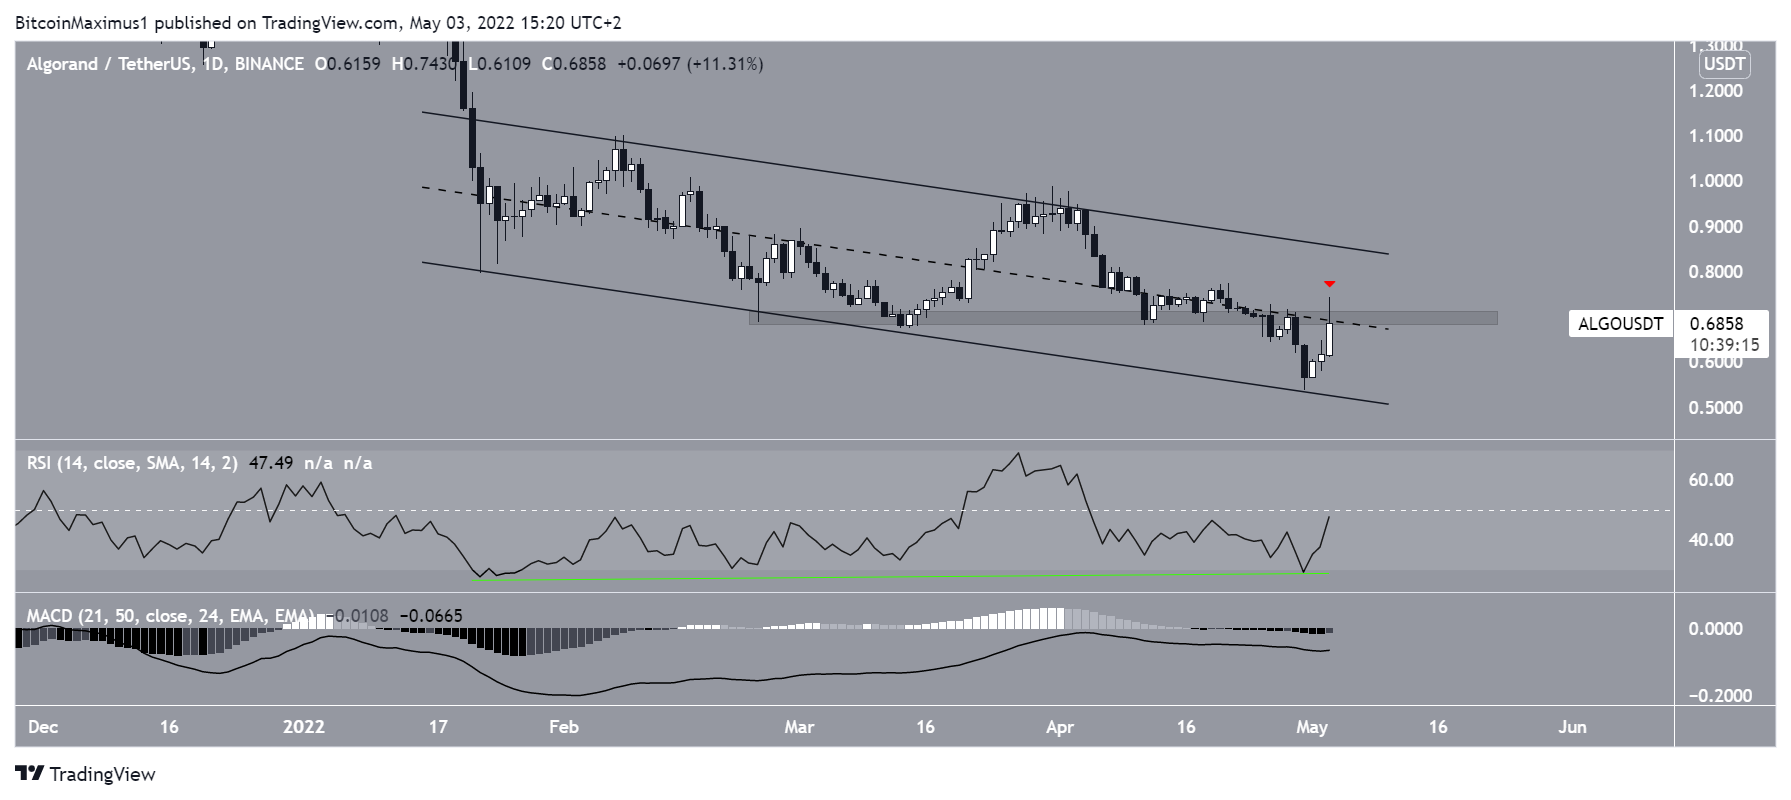
The daily time frame shows that ALGO has been trading inside a descending parallel channel since Feb. 6. Such channels are considered corrective structures. This means that a breakout from it would be the most likely scenario.
Be that as it may, technical indicators in the daily time frame are not bullish. Similar to the weekly time frame, the RSI and MACD are both falling, despite the bullish divergence in the RSI.
Currently, ALGO is attempting to reclaim both the middle of the channel and the $0.70 resistance area (red icon). If it is successful in doing so, a breakout from the channel would then be expected.
Considering that a breakout from the channel would also mean a reclaim of the long-term $0.75 area, it would go a long way in suggesting that the trend is bullish.

ALGO/BTC
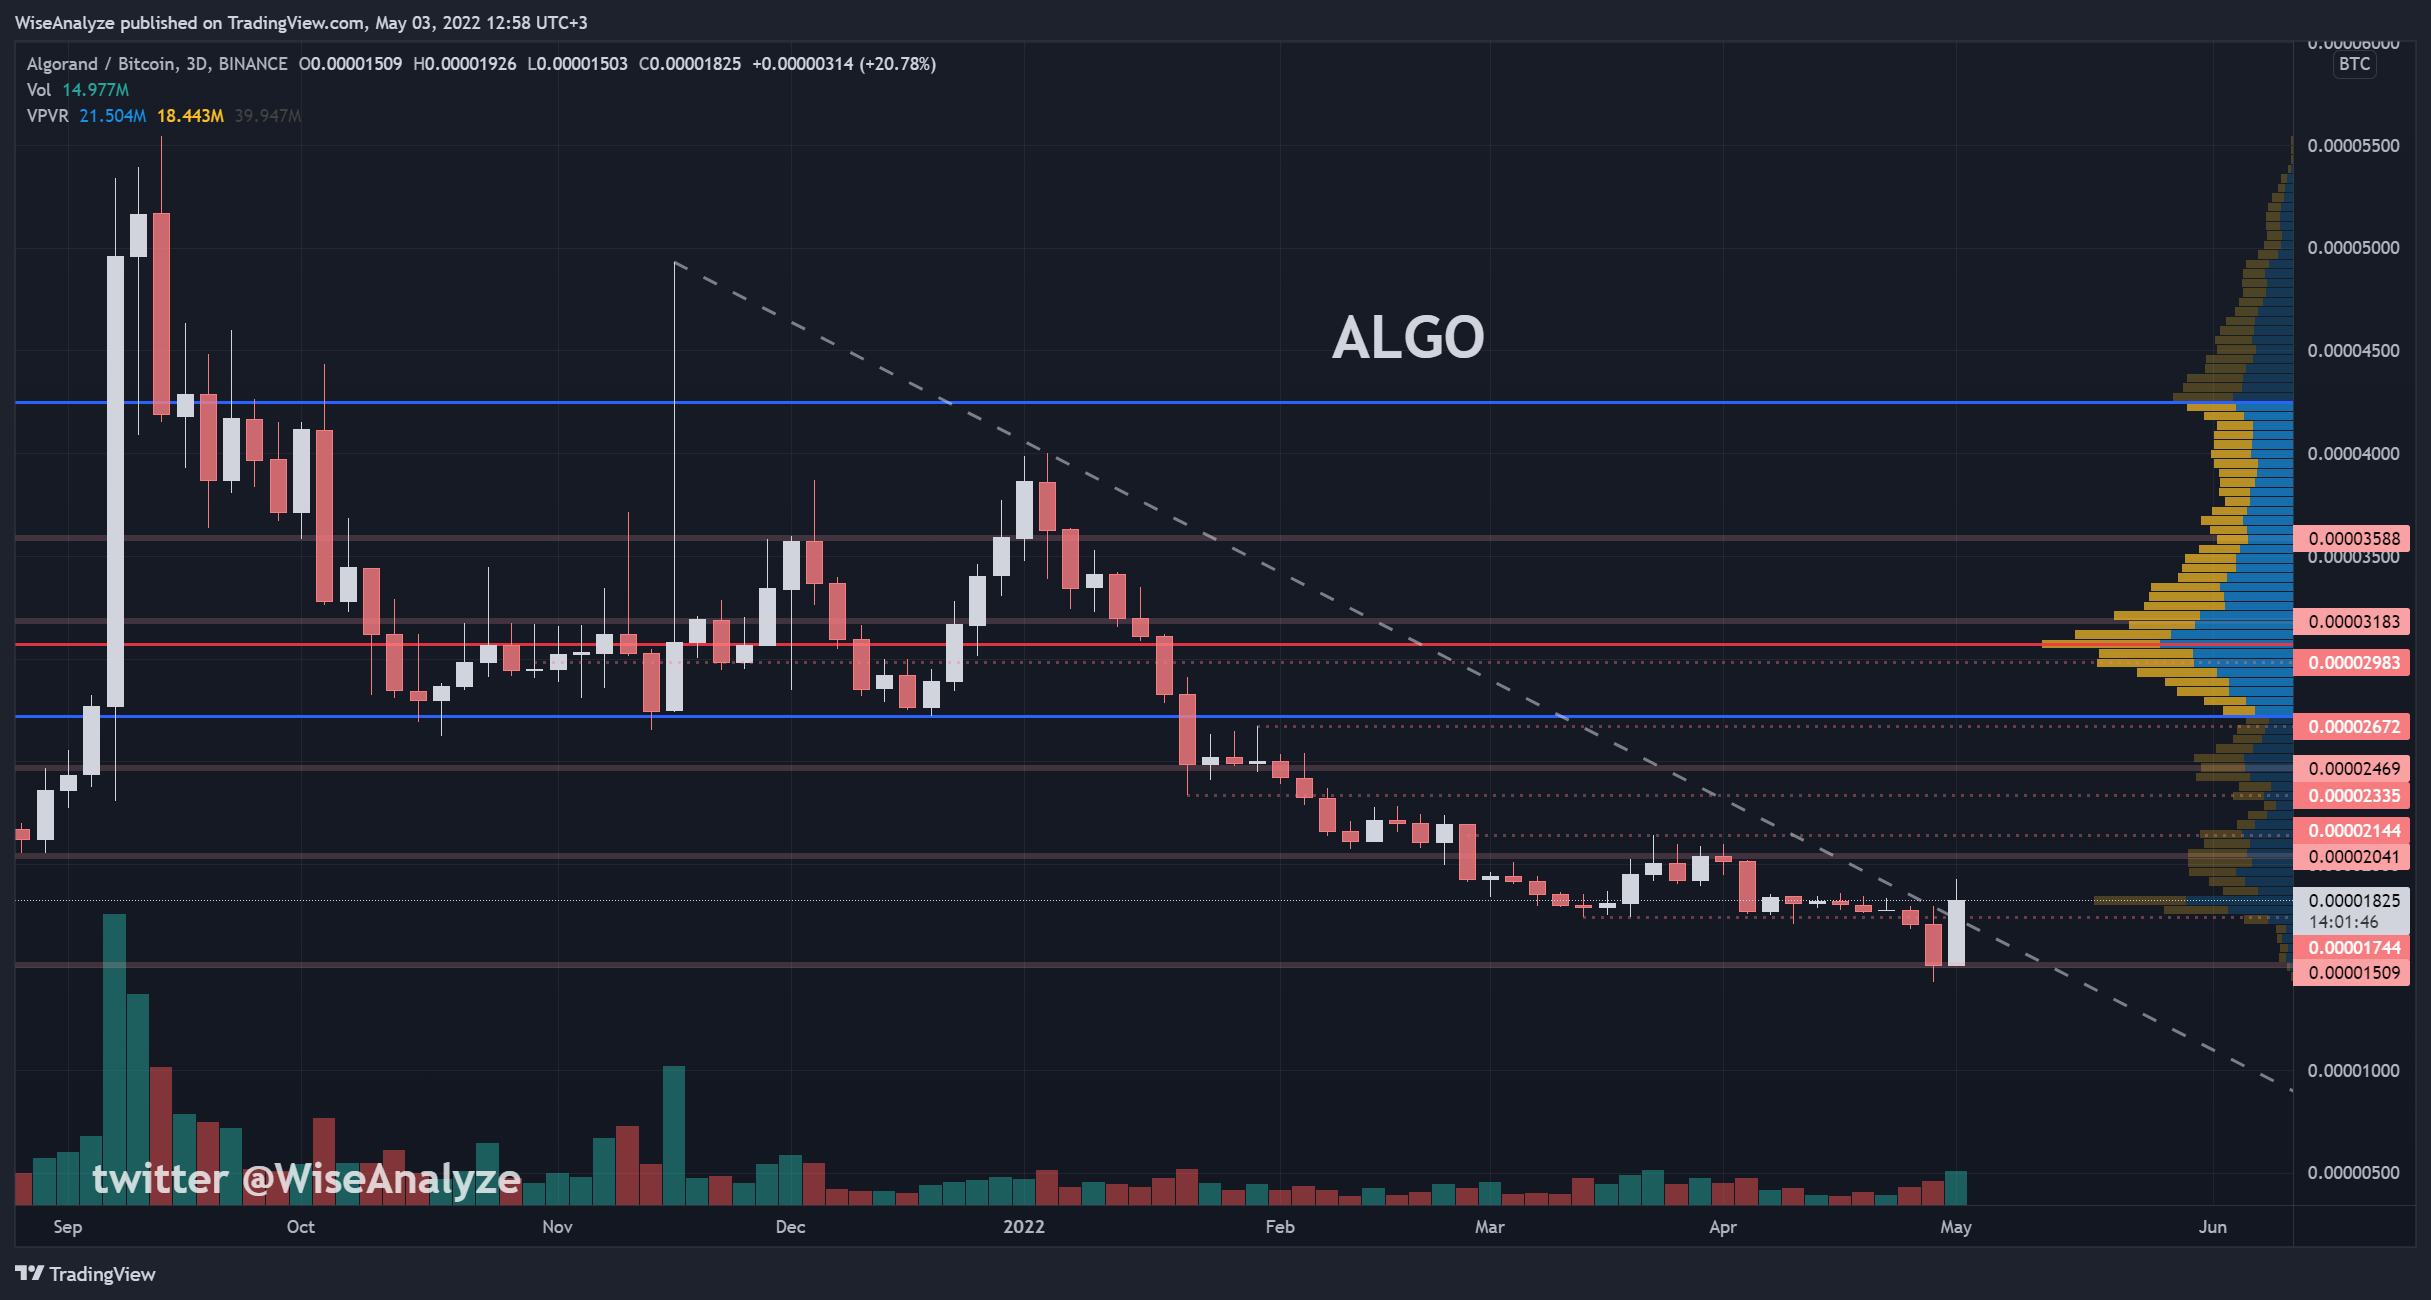
Technical analyst @WiseAnalyze tweeted a chart of ALGO/BTC, stating that the price is in the process of breaking out from a long-term descending resistance line.

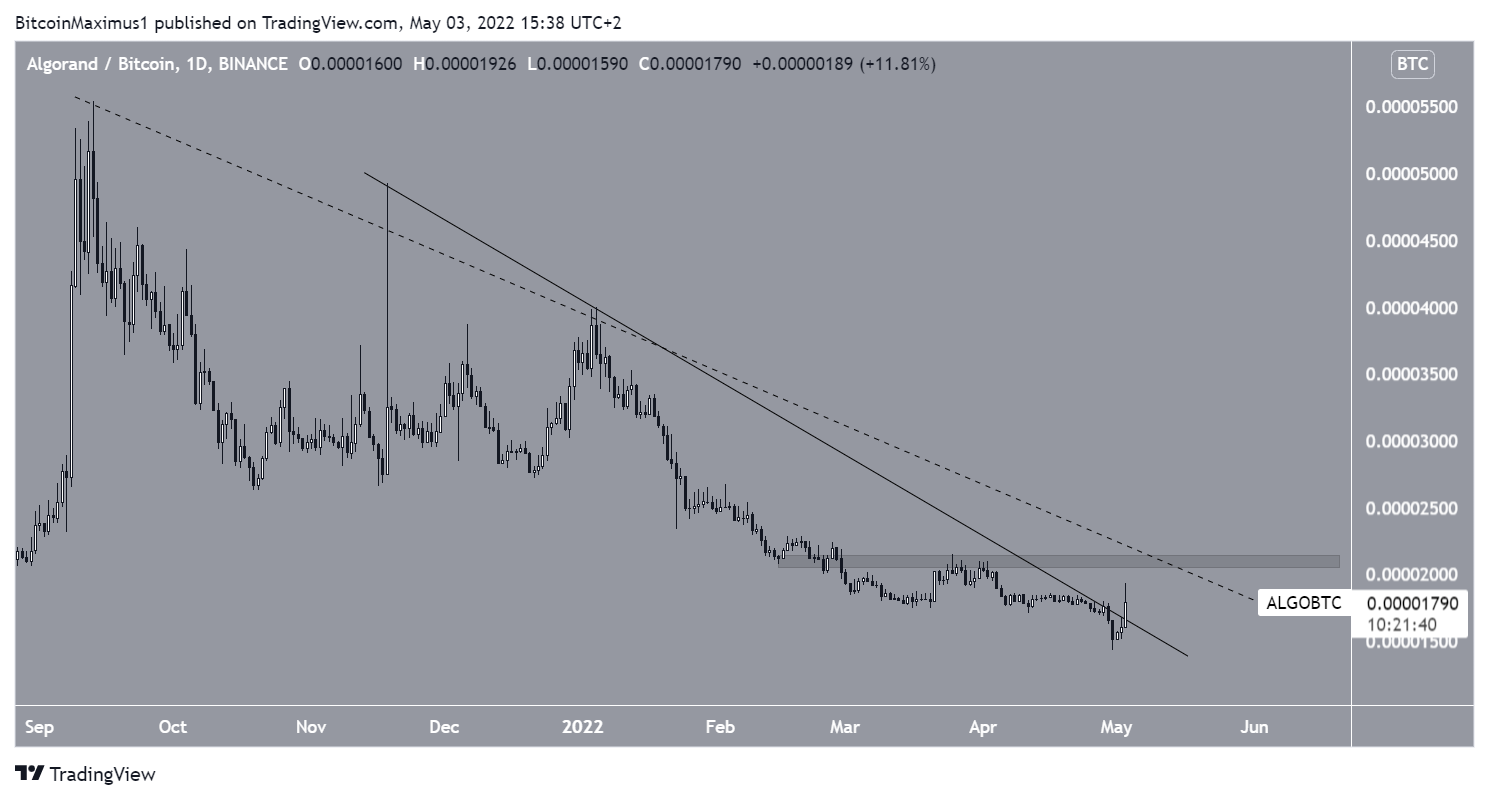
While ALGO/BTC has already broken out from the aforementioned resistance line, thanks in part to the latest news that the project would be partnering with World football’s governing body, FIFA, there is another resistance line (dashed), which has been in place since Sept. 2011. The line also coincides with the 2100 satoshi horizontal resistance area. Therefore, it is likely to provide strong resistance.
As a result, ALGO/BTC has to reclaim both the longer-term resistance line and the 2100 satoshi resistance area in order for the trend to be considered bullish.

For BeInCrypto’s previous Bitcoin (BTC) analysis, click here
Disclaimer
All the information contained on our website is published in good faith and for general information purposes only. Any action the reader takes upon the information found on our website is strictly at their own risk.


