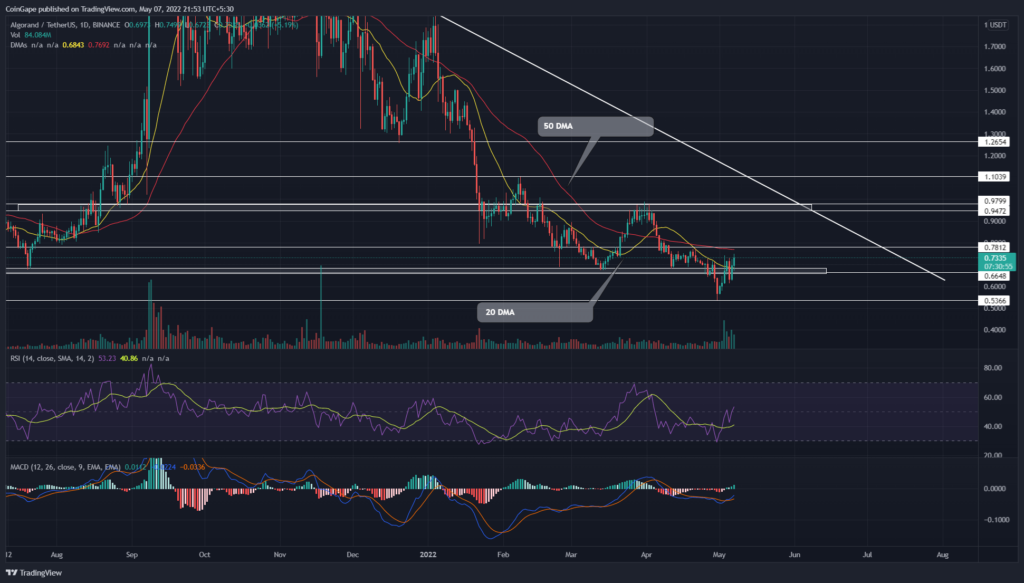
Struggling to settle the trend volatility near the $0.66 support zone, the (Algorand)ALGO prices gain bullish influence as the overall crypto market is recovering positively after a sharp fall. But should you consider buying into the bullish rally or wait till the trend settles?
Key technical points:
- The MACD indicator shows a bullish crossover.
- The ALGO price breached the 20-day EMA dynamic resistance.
- The 24-hour trading volume in the Algorand coin is $716.6 Million, indicating a 397% gain.
Source-Tradingview
On April 29th, the (Algorand)ALGO price breached the multi-month support of the $0.66 mark, suggesting the continuation of the downtrend. A follow-up bearish candle tumbled the altcoin by 16% and slumped it to $0.54.
However, the sellers couldn’t extend the downtrend any further and rebounded from the $0.54 support. Finally, the buyers push the coin above the $0.68 resistance indicating a support fallout.
Trending Stories
If the ALGO price sustained above the $0.68 mark, the trapped sellers would eventually liquidate their holding and bring more buy orders into the market. The rising bullish momentum would drive the altcoin above the $0.8 mark.
On a contrary note, the fallout from the $0.66 would threaten the bullish thesis and plunge back to the $0.53 mark.
Technical indicators:
The Daily-RSI indicator chart showed a steeper rally indicating the rising underline bullishness. In addition, the RSI slope surged above the midline, giving additional confirmation for long buyers.
The ALGO buyers reclaiming the 20-day SMA indicates an early sign of recovery. However, the 50-day SMA aligned with $0.8 resistance would interrupt a steady recovery.
The MACD indicator shows a bullish crossover but lacks a spread to promote recovery. However, a further increase in bullish spread and crossover above the zero line will indicate a buying spot.
- Resistance levels: $0.78 and $1
- Support levels: $0.66 and $0.54


