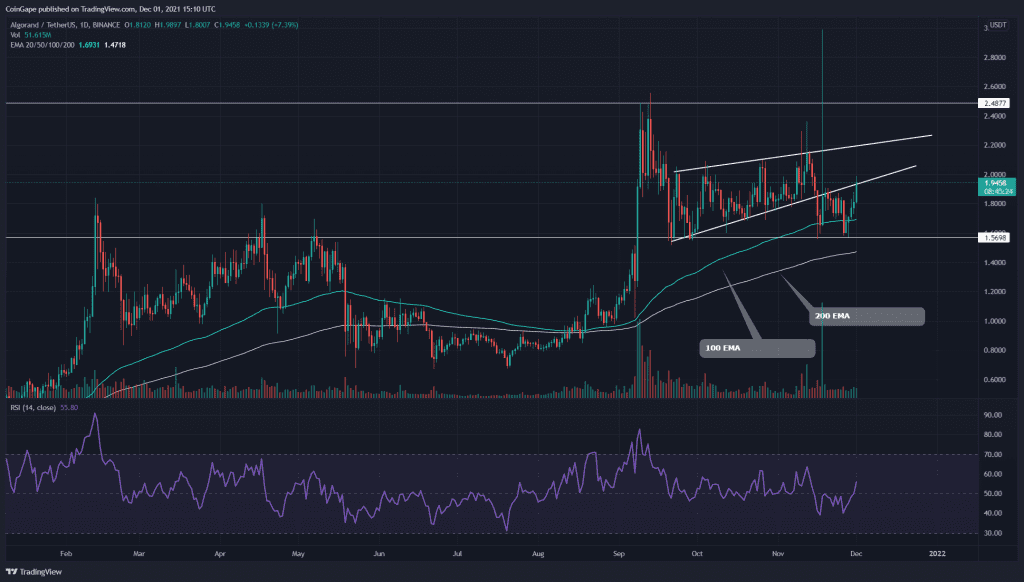
The ALGO coin maintains an overall bullish trend in its technical chart. The coin price has recently bounced back from crucial support of $1.56, and now with a double bottom pattern, it suggests a possible rally in the upcoming trading session. Watch out for these resistance levels in a long position.
Key technical points:
- The ALGO price bounced back from the $1.56 support level
- The ALGO price reclaims the 50-day EMA line
- The intraday trading volume in the ALGO coin is $737.6 Million, indicating a 68.18% hike.
Source- ALGO/USD chart by Tradingview
The ALGO/USD chart displayed the price resonated in a rising channel pattern in the daily time frame. On November 16th, the coin price provided a decisive breakdown from its support trendline, indicating a great short opportunity for crypto traders.
Though the ALGO price provided a decent retest to the new resistance trendline, the coin couldn’t pass an important support level of $1.56, providing significant demand pressure below this level.
The Relative Strength Index(56) indicated an impressive recovery concerning the recent bullish reversal from the bottom support.
ALGO/USD 4-hour Time Frame Chart

Source- ALGO/USD chart by Tradingview
The ALGO coin showed a double bottom pattern in the 4-hour time frame chart. However, in addition to the neckline of the $1.56 mark, this coin will also be facing resistance from the ascending trendline, which was earlier providing good support in a parallel channel.
Furthermore, the price has already provided a breakout from these resistance levels, and if the price shows good sustainability above them, the crypto traders should get a good entry opportunity to go long.
Moreover, the crypto trader can expect the next resistance level for the price at $2.1, followed by 2.28


