With the end of November closing in, it is imperative to analyze how the market’s altcoins are faring to gain a sense of direction. Especially as the end of Q4 nears.
It is in this context that Chainlink’s case is interesting. The altcoin hasn’t been blowing up on the charts like many other cryptos. Instead, it is revisiting its past.
Chainlink links back to May
Chainlink is a promising network without a doubt, but as much as the network has grown, its token hasn’t complemented the growth in any way.
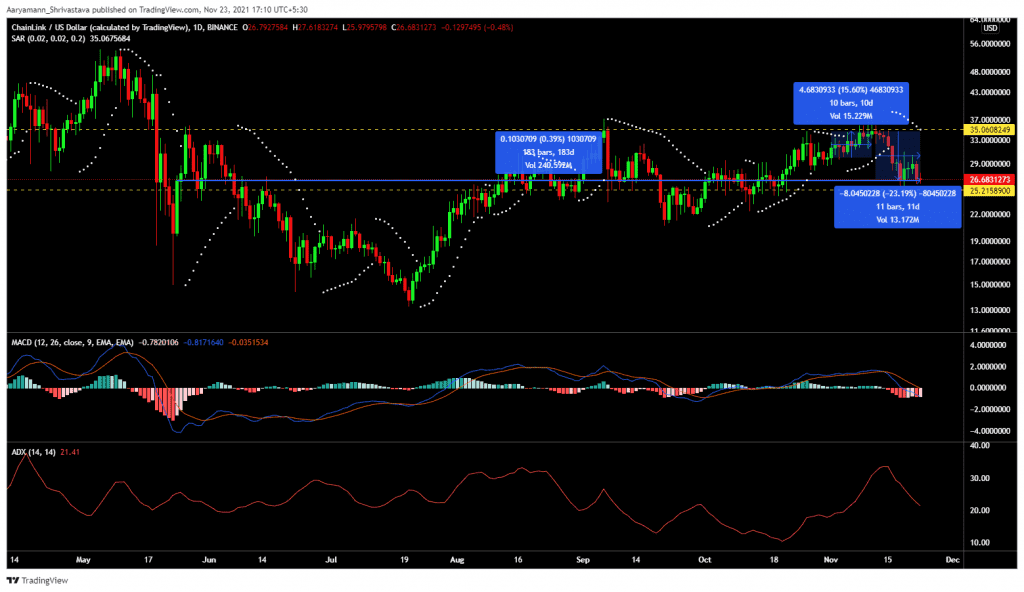
Even though it started out strong this month, barely 10 days into November, it began tumbling on the charts. At the time of writing, it was trading at $26.8, down by 23%.
However, the problem isn’t that it dropped down, the problem is that it hasn’t gone up in a very long time. For starters, the altcoin hasn’t marked a new all-time high despite many believing the altseason is already here.
Secondly, on the macro scale, it is still rangebound between $35 and $25, with LINK only breaching the support line.
Third, over a period of 6 months, the alt’s price has moved by no more than 0.39%. Over the same period, altcoins like Solana and even Shiba Inu have achieved mind-bending feats.
Chainlink price action | Source: TradingView – AMBCrypto
Despite being an interoperable and highly integrated chain, just because of the lack of growth, the crypto has fallen from its position of #15 to its press time position of #19. Understandably, this has also led to its investors suffering.
Velocity has also been consistently dropping since the average holding time of LINK is 2.7 years. This is why tokens don’t change hands very frequently. Furthermore, this has led to Long Term Holders holding 27% of all LINK supply.

Chainlink owner distribution | Source: Intotheblock – AMBCrypto
With HODLing being the natural state of investors, active addresses are getting weaker by the day. Also, since the price fall, their ratio to addresses with balance has dropped to 0.64%

Chainlink active address ratio | Source: Intotheblock – AMBCrypto
Finally, on top of that, constantly active LTH selling since May has led to the supply on exchanges rising.

Chainlink supply on exchanges | Source: Santiment – AMBCrypto
All these reasons, combined, are why Chainlink’s network growth and market value have pretty much been underwhelming. The latter has actually dropped by 33% over the last 10 days and reset back to its May levels.
Looking at the Average Directional Index (ADX), it is clear that the bullish trend has come to an end (ref. Chainlink Price action image).
And, until the LINK market resets, the price will probably be close to the support line of $25. If it falls any further, the altcoin might soon be out of the top 20.


