Ankr (ANKR) has been moving downwards since April 2 and has broken down from a potential short-term bullish structure.
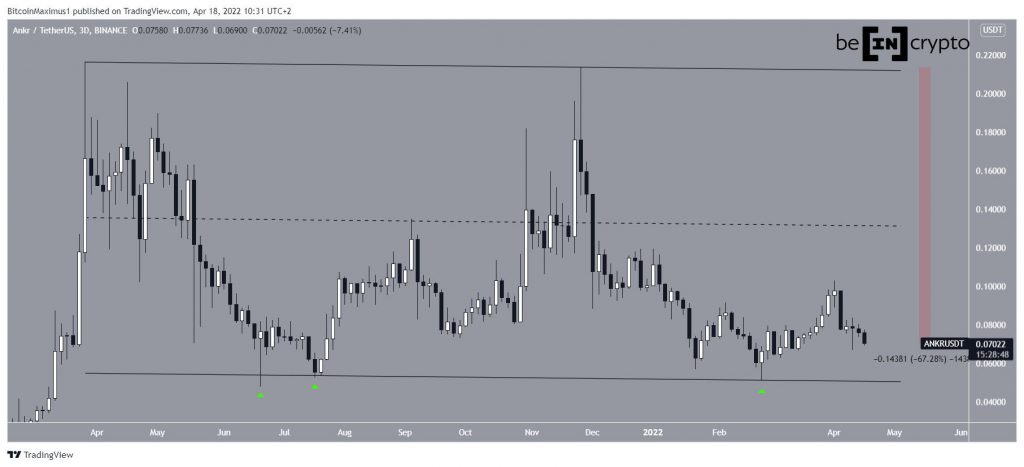
ANKR has been falling since reaching an all-time high price of $0.21 on March 28 last year. After it regained its footing in July of the same year, it initiated another upward movement that nearly led to yet another new all-time high price.
However, it created a lower high in Nov 2021 and has been decreasing since. So far, it reached a low of $0.051 on Feb 24.
The entire movement since the April all-time high can be contained inside a descending parallel channel, which was validated for the final time (green icon) in Feb 2020. Such channels usually contain corrective movements, meaning that an eventual breakout from it would be the most likely scenario.
For now, the main resistance area seems to be at $0.132. This is the 0.5 Fib retracement resistance level and the middle of the channel.
Measuring from the Nov high, ANKR has decreased by 67% so far.
Future ANKR movement
The daily time frame provides a mixed outlook.
ANKR has been following an ascending support line since Jan 20. The line is currently at $0.065. If the price touches it once more, it would be the fourth validation of this line.
However, despite the line being in place, technical indicators in the daily time frame are mostly bearish.
While the Jan upward movement was preceded by bullish divergences in both the RSI and MACD (green lines), their trendline is close to being broken.
Furthermore, the RSI is below 50 and the MACD is negative. This is a bearish sign that is often associated with bearish trends.
The six-hour time frame supports these findings since it shows that ANKR has broken down from a shorter-term ascending support line.
Currently, ANKR is right at the 0.618 Fib retracement support level and could soon break down. If so, it would be expected to revisit its Feb lows.
Wave count analysis
Cryptocurrency trader @JacobEmmerton tweeted a chart of ANKR, stating that the price has just begun a long-term wave five.
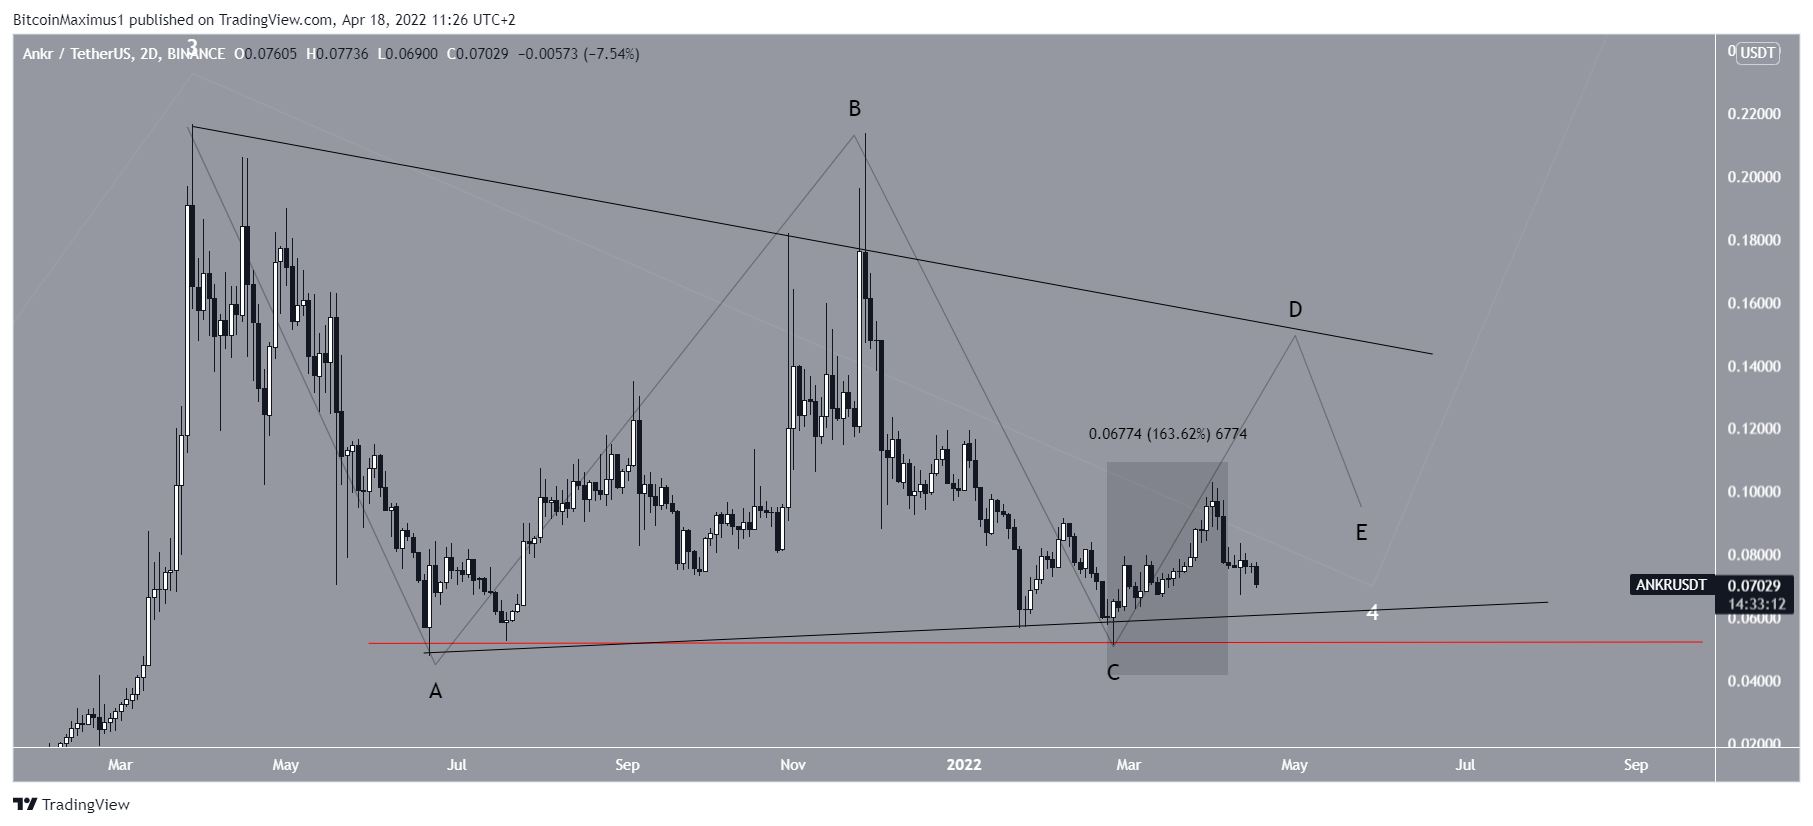
Measuring from the March 2020 low, the most likely count does suggest that ANKR is either in wave four or has just completed it (white). The fact that the movement is contained inside a channel supports this possibility.
If correct, the fifth and final wave could take the price towards a new all-time high price.
However, the shorter-term movement casts some doubt on the possibility that wave four is complete.
Firstly, the Feb 2022 low fails to sweep that of July 2021 (red line). Secondly, the upward movement is a three-wave structure instead of a five-wave one.
Therefore, the most likely possibility is that ANKR is still in wave four, which has potentially taken the shape of a symmetrical triangle.
After the correction is complete, wave five would be expected, which would take ANKR towards a new all-time high.
For Be[in]Crypto’s latest Bitcoin (BTC) analysis, click here
Disclaimer
All the information contained on our website is published in good faith and for general information purposes only. Any action the reader takes upon the information found on our website is strictly at their own risk.


