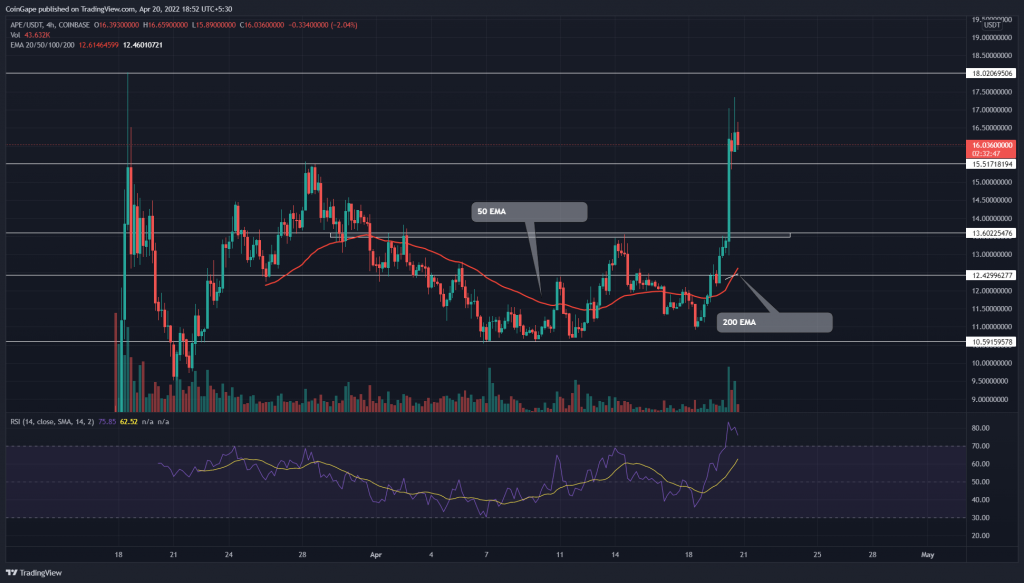
The native token of Bored Ape NFT-Apecoin has attained huge popularity in the last few days, presenting a 56% gain from the April 18th low of $10.93. The reason behind this exponential growth was whale accumulation and a new launch announcement by founder Yuga Labs for its upcoming metaverse-‘Otherside’. As a result, the APE price reflects a 22% intraday gain and a new record high of $17.35.
Key points:
- The post retest rally would raise the APE price to the $18 mark
- The APE chart shows a golden crossover between the 50-and-200-day EMA
- The intraday trading volume in Apecoin is $2.6 Billion indicating a 351.5% gain.
Source- Tradingview
The prevailing broader market condition reverted the Apecoin(APE) price from $13.6 resistance and dumped it to $11. However, the buyer showed strong interest in this discounted price and rebounded the coin on April 18th.
The post-correction rally pushed the APE price to the $13.6 neckline of the cup and handle pattern. However, the altcoin witnessed a massive inflow amid the metaverse announcement and breached the $13.6 and weekly resistance of $15.5 in one strike.
The post-retest rally from the $15.5 flipped support has accounted for an additional 8% gain, currently trading at the $16.36 mark. The sustained buying would push the APE price to the March 18th high of $18.
Trending Stories
However, the high-wick rejection near the $17 mark suggests the buyers are exhausted, and the coin price may provide another pullback opportunity. The expected correction could hit the $15.5 or $13.6 before continuing its bull run.
advertisement
Technical Indicator
The technical chart shows the massive price jump, which has moved far ahead of the crucial EMA slopes(20, 50, and 100). However, an excessive distance between the price and moving average reflects aggressive buying in the market and would eventually revert the coin to stabilize the bull run.
The RSI indicator(80) witnessed a similar parabolic rally, indicating strong bullish momentum. Nonetheless, the slope may soon enter the overbought territory, bolstering the pullback theory
- Resistance levels: $17 and $18
- Support levels: $15.5 and $13.6


