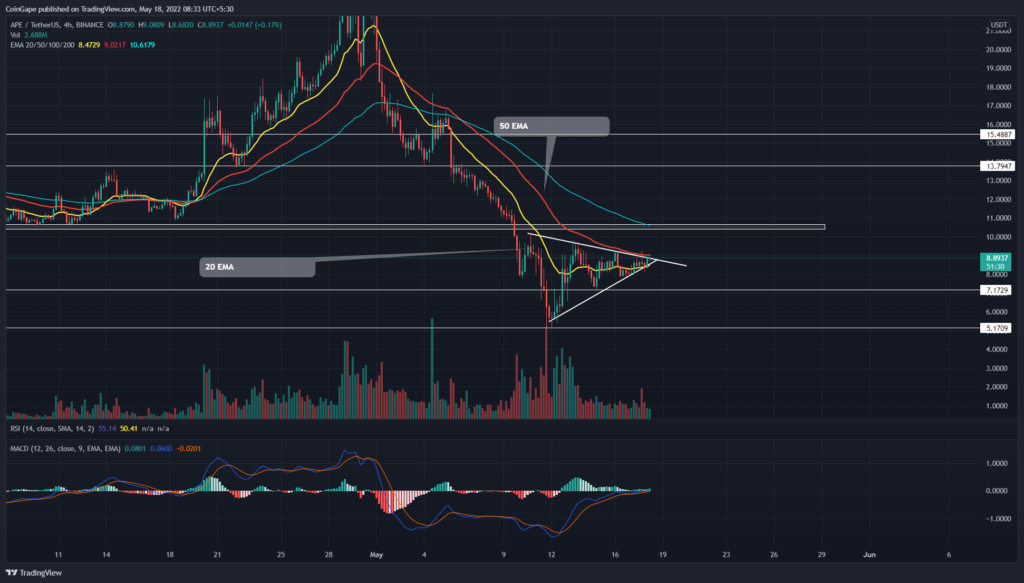
The recent downtrend took a breather at the $5.17 mark and witnessed a consolidation phase coiling the price between the $9.7 and $5.17 support. The Apecoin(APE) revealed a symmetrical triangle pattern in response to this consolidation, putting a recovery opportunity on the cards.
Key points:
- A possible breakout could surge the APE coin by 55%
- The MACD-indicator indicates the possibility of a potential bull run and generates a signal to go bullish.
- The intraday trading volume in Apecoin is $846.5 Million marking a 20% gain.
Source- Tradingview
On April 29, the Apecoin(APE) witnessed an end to the ongoing bull run as it failed to sustain above the $23.76 mark. This dragged the price down to $13.79 before finding temporary support, signifying a 34% drop in just four days.
Interestingly, the APE price saw a sudden surge in the price on May 4, with an intraday gain of 9.98%, indicating an attempt to make up for the recent loss. However, the attempt fizzled out with a recent sell-off in the market, dragging the price further down to $5.17 in a week, which is another 62% drop from the previous support.
Ever since, the coin has been in a correction phase while forming a symmetrical triangle. This phase is an opportunity for the buyers to regain trend control and raise the price.
Trending Stories
A breakout from this symmetrical triangle could see the coin rise by 54% to the $13.8 mark.
advertisement
Conversely, a breakdown would mean a resumption of the prevailing downtrend.
Technical Indicator
The MACD and signal line rising despite consolidation in price action indicate a rise in underlying bullishness. In addition, these lines may soon breach the neutral line, bolstering a triangle breakout.
EMAs- the price consolidation has reclaimed the 20 EMA slope providing an additional edge to long traders. However, the 50 EMA in confluence with the descending trendline strengthens the overhead resistance.
- Resistance levels: $9.57 and $10.6
- Support levels: $7.17 and $5.17


