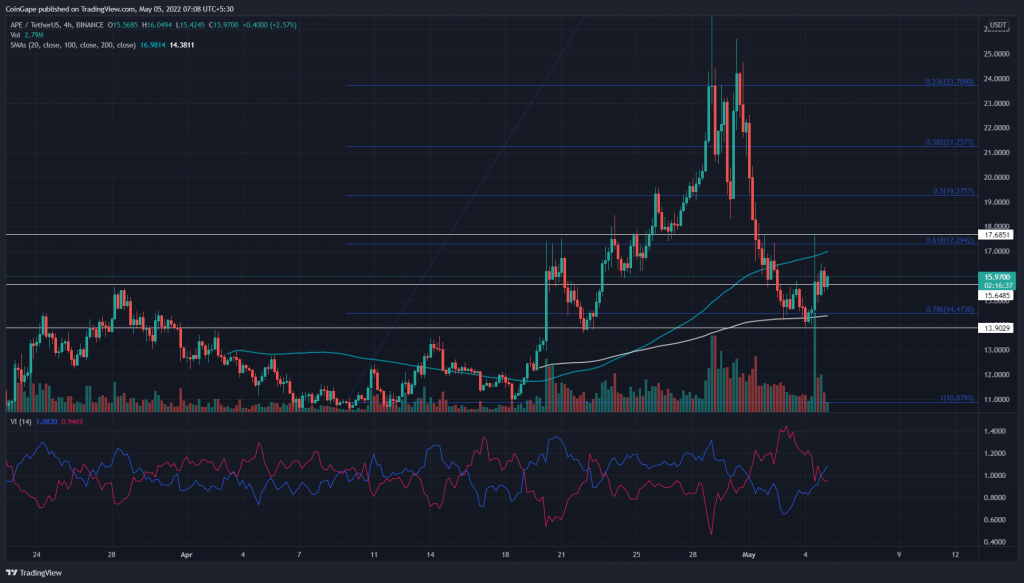
On May 4th, the Apecoin(APE) price rebounded from the 0.786 Fibonacci retracement level($14) with a long bullish engulfing candle of 10% intraday gain. Furthermore, this sudden gain was bounded by the event that the Billionaire Elon musk had his Twitter profile picture changed to a collage of several Bored Ape NFTs. As a result, the APE price continues to rise to form a double bottom pattern.
Key points:
- A possible breakout from the double bottom pattern would surge APE price by 10%
- The 20 SMA flipped to a viable support
- The intraday trading volume in Apecoin is $2.9 Billion indicating a 132% gain.
Source- Tradingview
The Apecoin(APE) buyers’ failed attempt to sustain above the $24 mark triggered a significant correction rally in the past four days. As a result, the altcoin lost 42% and plunged to the 0.786 FIB($14).
Moreover, the APE price retested the $14 support twice, forming a double bottom pattern in the 4-hour time frame chart. The chart pattern displays its neckline at $17.6 resistance, holding the key to a potential bull run.
Furthermore, the APE price rebounded from the $14 support on May 4th and has pierced local resistance of $15.6 local resistance. The altcoin currently trades at $16.1, with an intraday gain of 3.51% gain.
Trending Stories
If buyers sustain this breakout, the APE price will rally 8.6% higher to challenge the neckline resistance of $17.6. A bullish breakout to this resistance would provide an excellent long-entry opportunity for interested traders.
advertisement
Technical Indicator
The Vortex indicator offers a bullish crossover to encourage more buying in the market.
The APE price resonates between the rising 100 and 200 SMA, projects an overall uptrend. However, the 100 SMA situated near the $17.6 neckline resistance may stall the altcoin from completing the price pattern.
- Resistance levels: $17.6 and $19.2
- Support levels: $15.6 and $14


