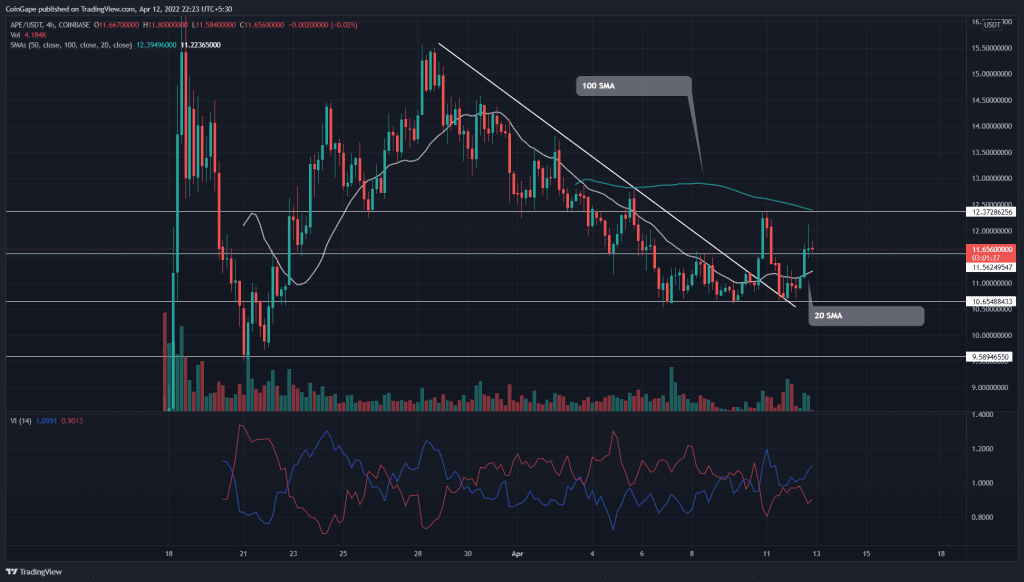
On April 10th, the Apecoin(APE) price gave a massive breakout from the falling channel pattern, suggesting the end of its correction rally. Furthermore, the coin price turned down from the $12.3 resistance to retest this breached resistance. The renewed buying momentum spiked the altcoin by 9.89% to its current value at $11.6.
Key points:
- The APE price breached the $11.56 resistance
- The 20 and 50 SMA are poised for a bullish crossover
- The intraday trading volume in Apecoin is $630.5 Million indicating a 15% loss.
Source- Tradingview
The APE/USDT pair witnessed a significant correction in the past two weeks, which discounted the altcoin by 32%. A falling channel pattern carried this retracement rally and plunged the coin price to $10.6 support.
Responding to the bullish divergence in the RSI indicator, the APE price bounced back from the $10.6 support and breached the resistance trendline of the channel pattern. Furthermore, the breakout rally reached the $12.3 resistance before reverting for a retest.
The descending trendline flipped into viable support and initiated a new recovery rally. The post-rest rally pierced the $11.5 local resistance and registered a 9.89% gain.
If the buyers sustain above this resistance, the coin price will rechallenge the $12.3 resistance to continue the bullish rally.
Technical Indicator
EMAs: The new recovery rally has regained the 20 and 50 SMA, which adds additional support levels for buyers. However, the 100 SMA slope aligned with the $12.3 resistance could interrupt the potential rally.
Vortex indicator: the VI+ and VI- slope widening the gap between them indicate strong buying momentum.
- Resistance levels: $12.3 and $13.7
- Support levels: $11.5 and $10.5


