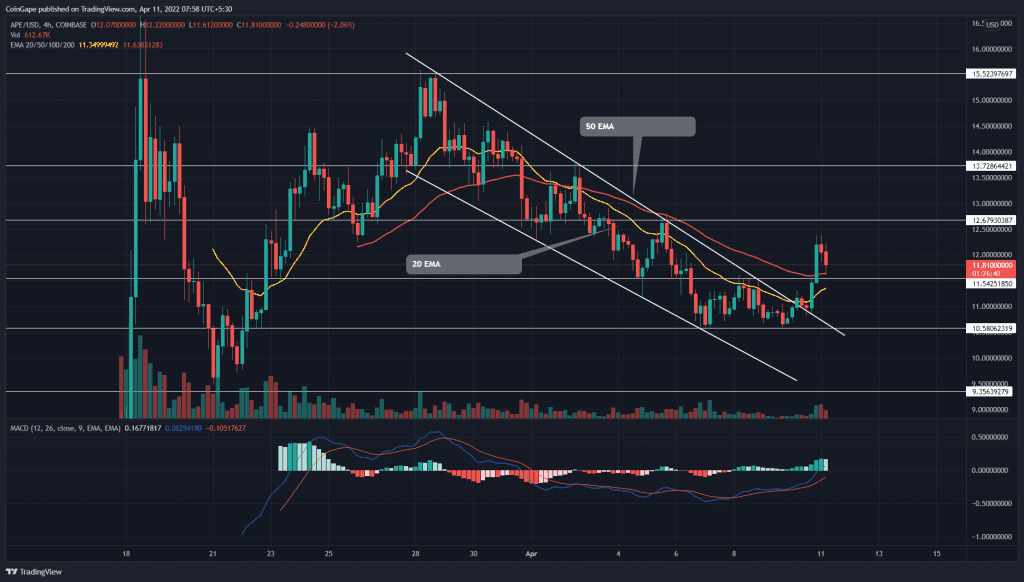
The falling channel breakout outburst a new recovery rally for Apecoin(APE) price. Currently, the coin price trades at the $11.88 mark, indicating a 12.3% gain from the $10.5 support. The altcoin is approaching the next resistance at $12.6, preparing for a bullish breakout.
Key points:
- The APE price rebounded from the $10.58 support with a bullish engulfing candle
- The 20 and 50 EMA dynamic resistance switched to a viable support
- The intraday trading volume in Apecoin is $978.65 Million indicating a 36% loss.
Source- Tradingview
The APE price gradually lowered over the last two weeks, responding to a falling channel pattern. As a result, the altcoin devalued by 31.5% and plunged to the $10.6 mark.
The altcoin rebounded from the bottom support on April 9th and gave a bullish breakout from the descending trendline of the channel pattern. The post-retest rally pierced through the shared resistance of $11.54 and 50 EMA, registering an 8.56% gain.
The rising bullish momentum would drive the APE price above the two following resistance levels, i.e., $12.6 and $13.7, before hitting the All-Time High resistance of $15.5.
However, the long traders may experience occasional pullback during the bull run, which simultaneously provides accumulation opportunities for maximizing gains.
Technical Indicator
EMAs: The early recovery rally has breached the two dynamics resistance levels of 20 and 50 EMA and converted them to suitable support levels.
MACD indicator: The MACD and signal lines present a quick upturn to the neutral line following a bullish crossover. The widespread area between these indicates strong bullish momentum.
- Resistance levels: $12.6 and $13.7
- Support levels: $11.5 and $10.5


