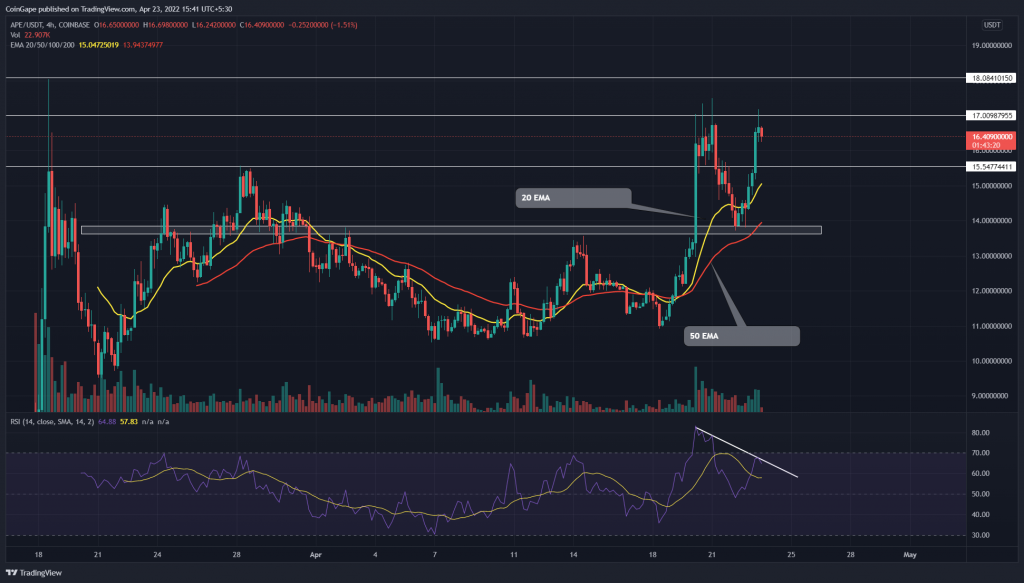
The post-correction rally has surged the Apecoin(APE) price by 25%, bringing it to $17 resistance. The buyers attempt to breach the overhead resistance; however, a negative divergence in the RSI chart undermines the bullish momentum.
Key points:
- A possible breakout could surge the APE coin by another 8%
- The Daily-RSI chart displays an evident bearish divergence
- The intraday trading volume in Apecoin is $1.95 Billion indicating an 80% gain.
Source- APE/USD chart by Tradingview
On April 20th, the Apecoin witnessed a massive pump amid the announcement of an upcoming metaverse called Otherside. The coin registered a 24.6% intraday gain and tagged the $17 mark.
Trending Stories
However, the APE chart displays multiple higher price rejection candles at that resistance, suggesting the buyers were exhausted from the sudden rise. The sellers eventually pull the price lower, offering a minor correction phase.
The pullback discounted the Ape price by 18% and plunged to the $13.8 support. However, with the rising popularity of Apecoin among whales, the coin price rebounded from this support and reached the $17 mark again.
With an 80% pump in trading volume, the APE buyers attempted a bullish breakout from 17%. If they succeed, the coin price will surge to the $18 mark, followed by a $20 psychological level.
Technical Indicator
Relative Strength Index- The RSI slope barely escaped from falling into the bearish territory and reverted immediately. The indicator shows a relatively short rally which reflects a bearish divergence concerning the April 20th peak.
This divergence suggests the APE/USDT pair may wetness another correction.
EMAs- The crucial EMAs(20, 50, 100) rise under a bullish sequence, indicating a strong bull trend. These EMAs could provide strong support during the occasional pullbacks.
- Resistance levels: $17 and $18
- Support levels: $11.5 and $10.5


