Disclaimer: The findings of the following analysis are the sole opinions of the writer and should not be considered investment advice
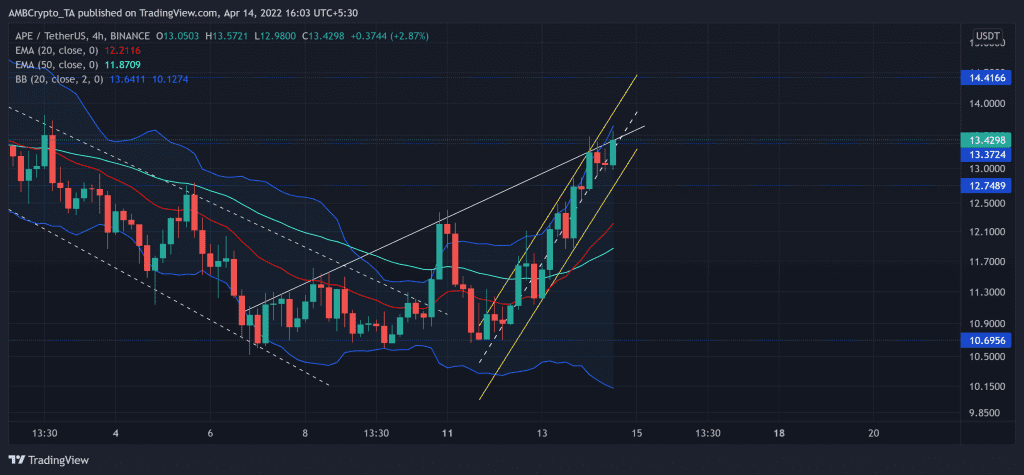
ApeCoin (APE) has done remarkably well over the last three days while recovering in an up-channel (yellow) on its 4-hour chart. Following its substantial plunge, buyers re-entered the market around the $10.6-mark and pulled the price up from its multi-week lows.
Going forward, the sellers could try to stall this high volatility phase and pose some barriers at the $13.3 resistance. The buyers needed to uphold the bounds of the current up-channel to prevent a downswing. At press time, APE was trading at $13.4298, up by 11.14 % in the last 24 hours.
APE 4-hour Chart
Soon after the Bored Ape Yacht Club introduced its new crypto ‘ApeCoin’ on 17 March, it drew a sizeable interest in the public eye.
After an exponential jump post its launch, the crypto found itself oscillating between the $10-$15 range over the past month. The most recent from the $10-base saw multiple bullish engulfing candles line up on APE’s 4-hour chart.
As a result, 20 EMA (red) was quick to accelerate over the 50 EMA (cyan) and project a bullish edge on the charts. This growth led the price to keep testing the upper band of the Bollinger Bands (BB) while breaking into high volatility.
As the trendline resistance (white) coincided with the $13.3 horizontal resistance, the bears would likely aim to pull the price toward the lower trendline of up-channel. A break below this pattern could cause a test of the $12.7-level support. The 20-EMA would likely offer support for a potential breakdown.
Rationale
For the most part, the bullish RSI corresponded with price and grew in an up-channel. A conceivable reversal from the overbought mark would position the RSI for a southbound trajectory.
Also, the CMF projected a bullish edge as the recent rally reclaimed the zero-line. Now, the bulls eyed to test the 0.06 resistance before a trend committal move.
As the Aroon up (yellow) and Aroon down (blue) indicators reached their peaks, APE’s price could face a minor setback.
Conclusion
Considering the confluence between multiple resistances in the $13- zone, APE could face a short-term decline. A break below its current pattern could reignite the bearish tendencies. In which case, the bulls needed to keep the 20 EMA’s support intact.
Even so, the investors/traders should factor in the broader market sentiment and the on-chain developments to make a profitable move.


