Despite the fact that it is approaching a new all-time high, Apecoin (APE) is showing weakness and is trading inside a short-term bearish pattern.
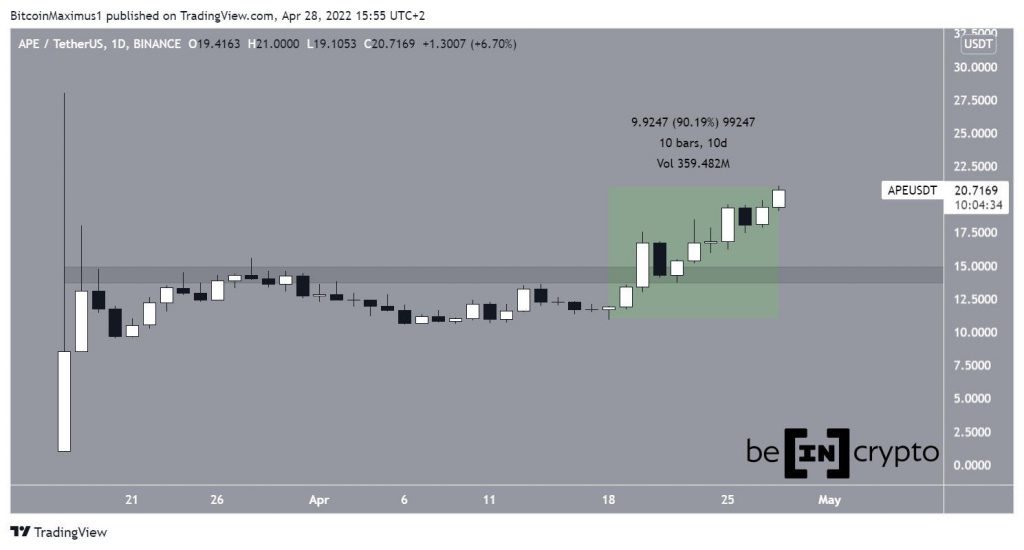
APE has been moving upwards at an accelerated rate since April 18, when it had reached a low of $10.90. In a span of only 10 days, the price increased by 90%, leading to a high of $21 on April 28.
While APE reached an all-time high price of $28 during its launch on March 17, the current high is the highest price reached since.
More importantly, the price has reclaimed the $14.30 area, which previously acted as resistance. The area is now expected to provide support.
Short-term APE movement
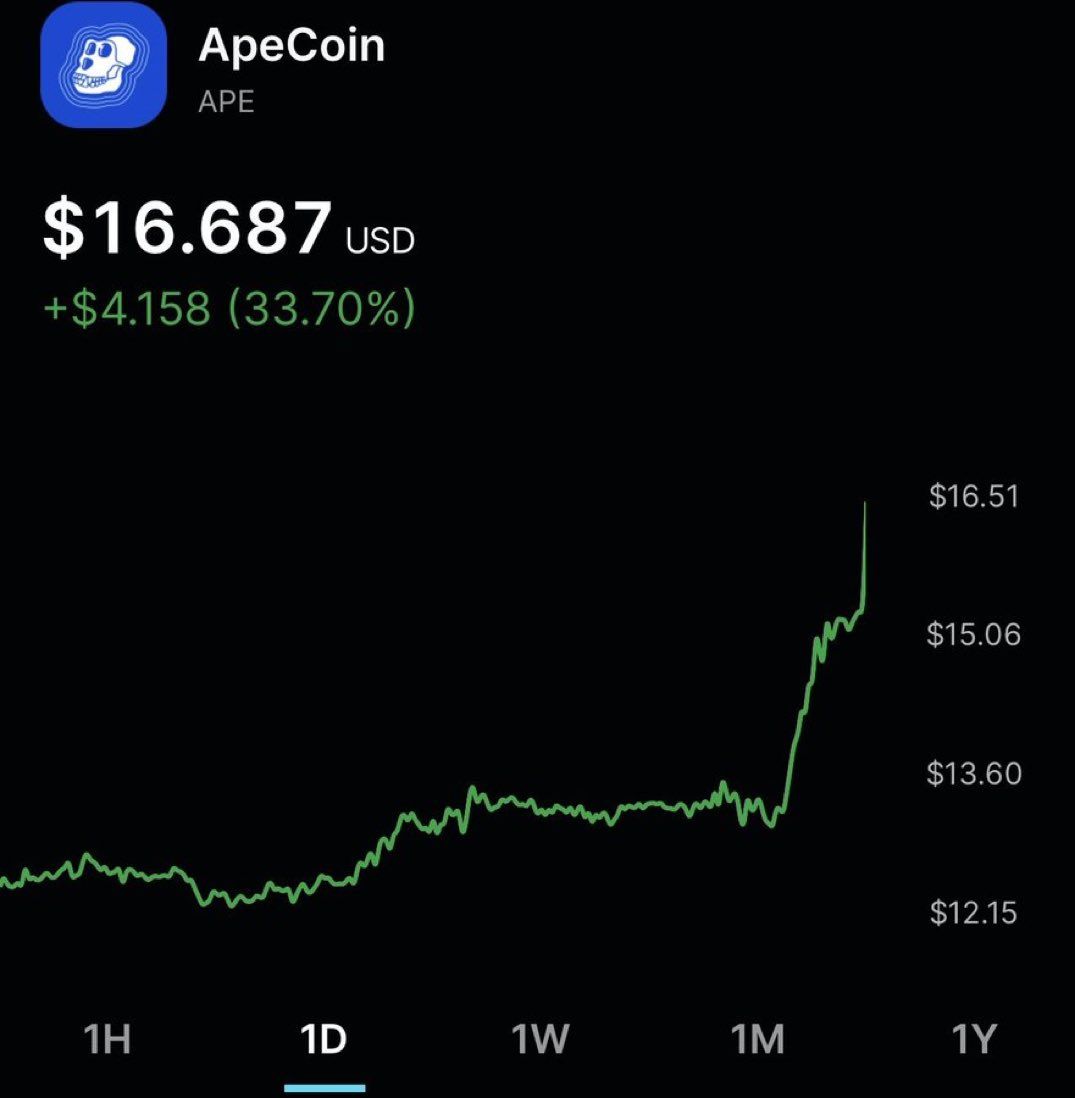
Cryptocurrency influencer @Jessehj1 tweeted a chart of APE, stating that the price is gradually approaching a new all-time high.
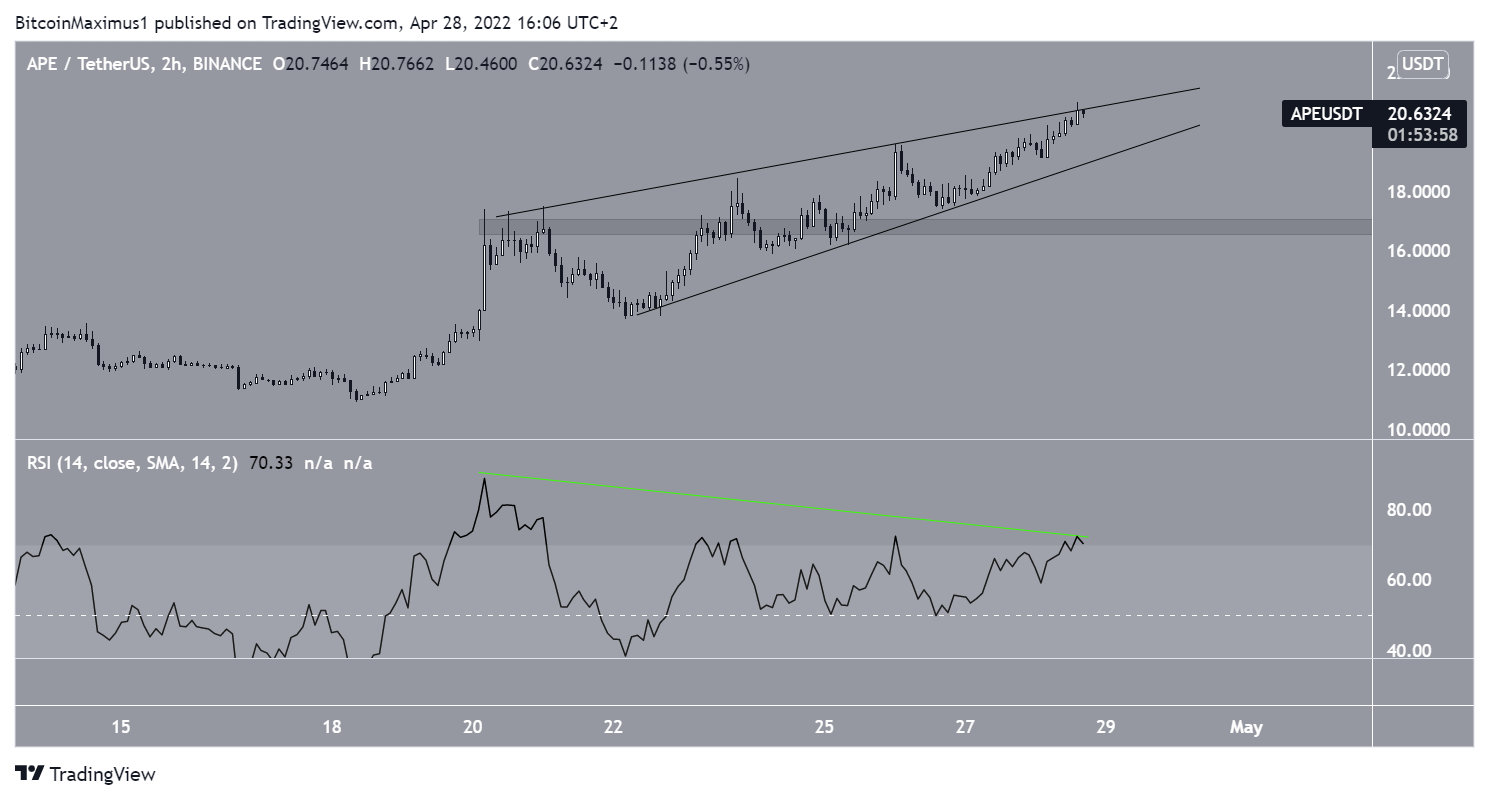
The two-hour chart shows that APE has been trading inside an ascending wedge since April 20. The wedge is considered a bearish pattern, meaning that a breakdown from it would be the most likely scenario.
Furthermore, the pattern has been combined with bearish divergence in the RSI. As a result, a breakdown from it would be the most likely scenario.
If one occurs, the closest resistance area would be at $16.80.
Wave count analysis
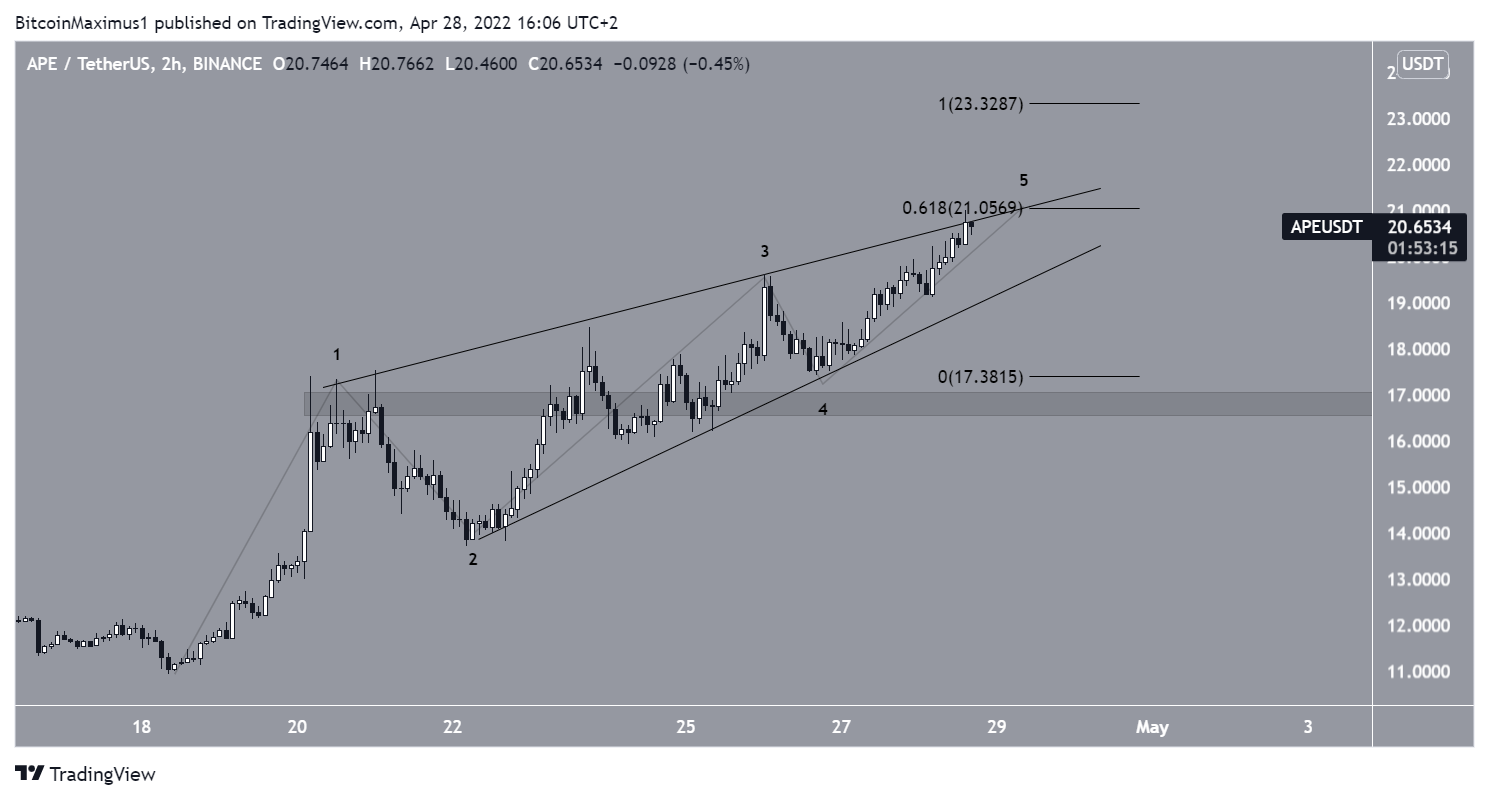
The wave count supports the possibility of a short-term decrease, since it indicates that APE is completing an ending diagonal, hence the shape of the wedge.
Currently, waves 3:5 have a 1:0.618 ratio, which is the most common one for such patterns.
An increase above $23.32 would invalidate this pattern, since it would make wave three the shortest of the bullish waves.
For Be[In]Crypto’s latest Bitcoin (BTC) analysis, click here.
What do you think about this subject? Write to us and tell us!
Disclaimer
All the information contained on our website is published in good faith and for general information purposes only. Any action the reader takes upon the information found on our website is strictly at their own risk.


