Published 21 mins ago
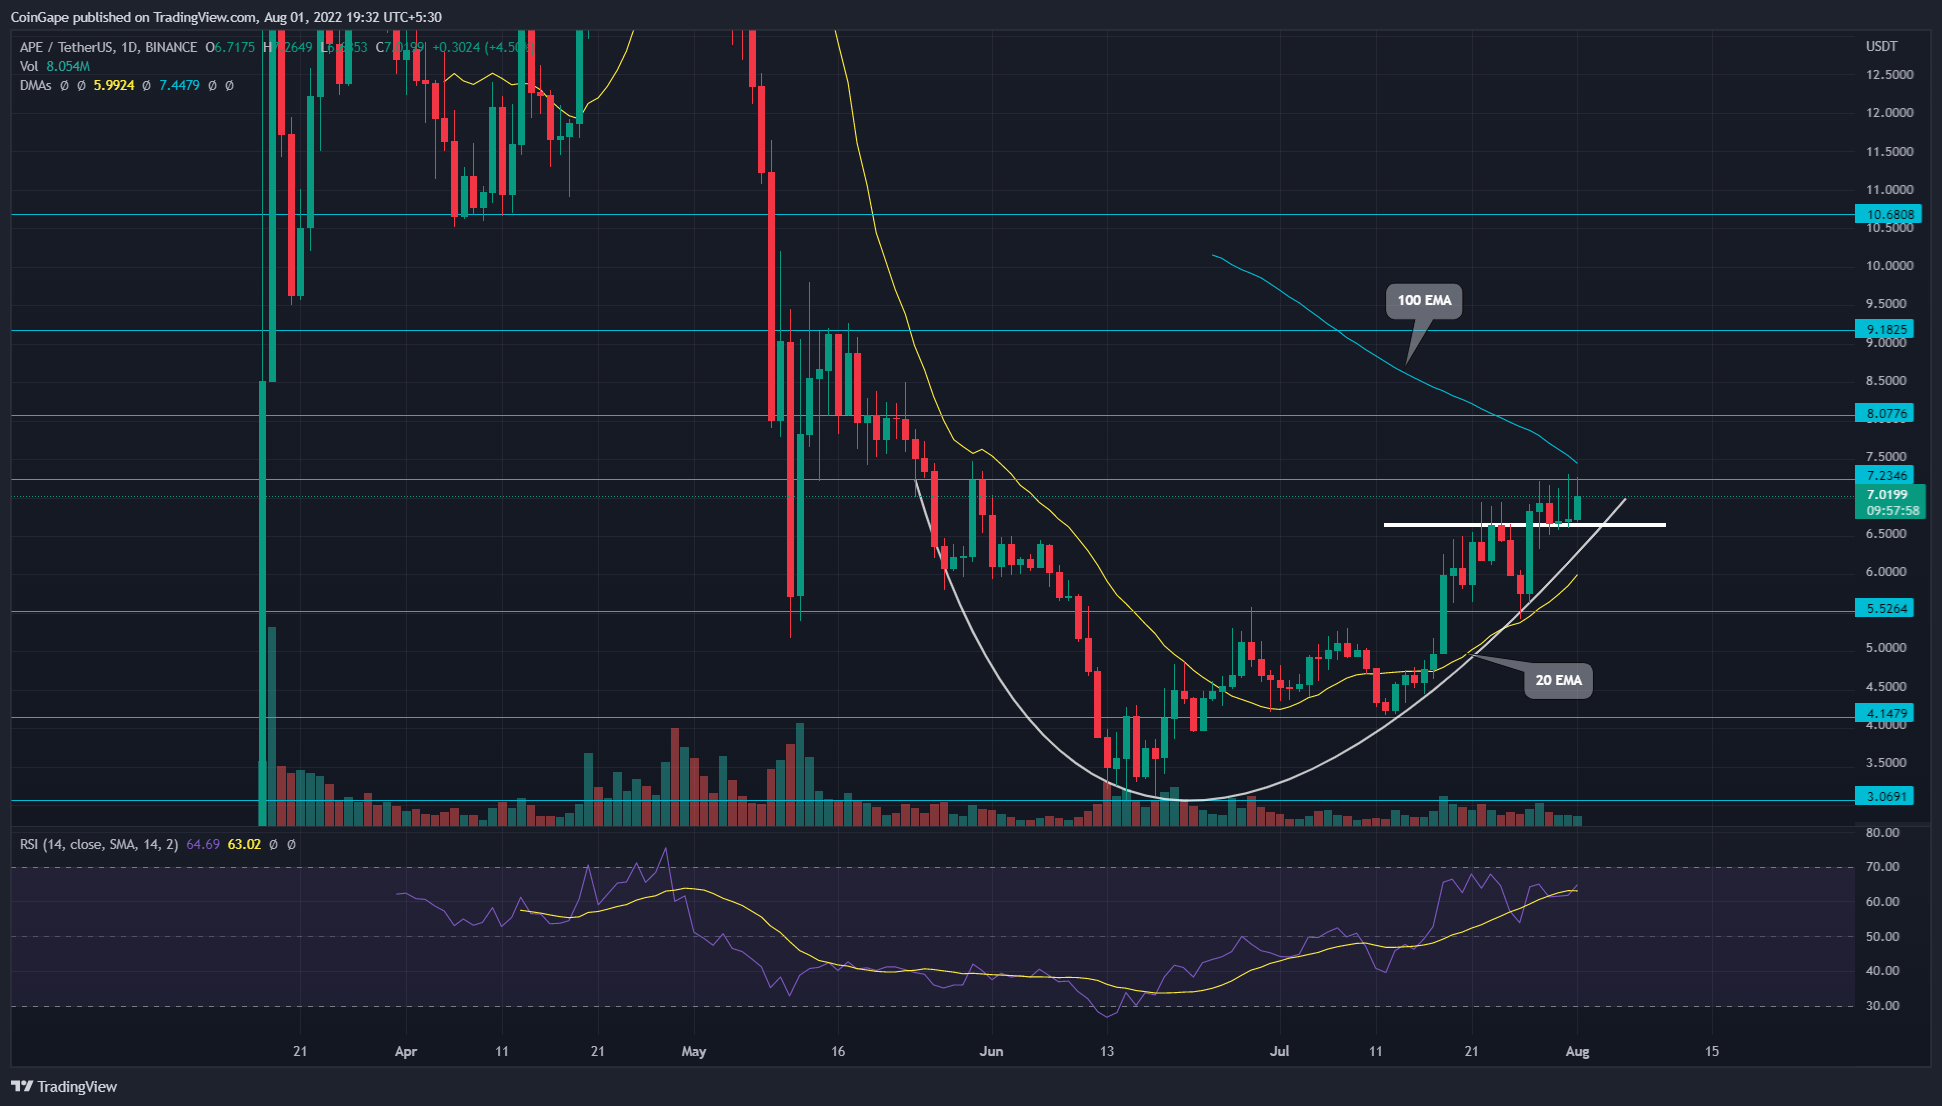
The ongoing recovery rally in APE price stalled at $7.23 resistance. Despite showcasing several attempts to breach this barrier, the buyers couldn’t surpass the $7.23 mark in the past four days. Even today, the coin price is 3.75% up, but the long rejection attached to it indicates another failed attempt from buyers.
advertisement
Key points:
- The $7.23 breakout would trigger a directional rally in APE
- A breakdown below $5.52 would imply weakness in buyers’ commitment
- The intraday trading volume in the APE is $575.5 Million, indicating a 53.4% gain

Source- Tradingview
The APE/USDT downfall took a complete turnaround after the price hit a $3.09 low. Amidst the improving market sentiment, the price action knocked out multiple resistance levels and showed a constant rally since last month.
On July 28, the bull-run tagged the $7.23 mark, registering a 138% growth since the mentioned low. However, the APE price showed several attempts to breach the overhead resistance, but all ended with long-wick rejection candles.
Trending Stories
These failed trials hint the bullish momentum is exhausted, and the price may witness a significant correction before resuming the recovery rally. Furthermore, the price action shows a minor support level at the $6.63 mark, indicating a narrow consolidation.
Therefore, the daily candlestick closing beyond either barrier of the constitution will determine further movement in APE price.
Thus, if the sellers pull the altcoin below the $6.63 support, the traders may witness a 17% correction to the $5.52 support. However, losing this support would indicate weakness in bullish momentum, leading to further downfall to the $4.14 mark.
On the other hand, a candle closing above the $7.23 resistance will offer another breakout opportunity to buyers with a 26.7% higher target of $9.18.
Technical indicator
EMAs- The downsloping 100 DMA line is nearing to APE price would add additional selling pressure on traders. On the flip side, the short-term recovery is led by the dynamic support of the 20 DMA.
advertisement
RSI indicator– a slight bearish divergence in RSI slope concerning the new higher high in price supports the pullback theory.
- Resistance levels- $7.23 and $8
- Support levels- $6.63 and $5.2
Share this article on:
The presented content may include the personal opinion of the author and is subject to market condition. Do your market research before investing in cryptocurrencies. The author or the publication does not hold any responsibility for your personal financial loss.


