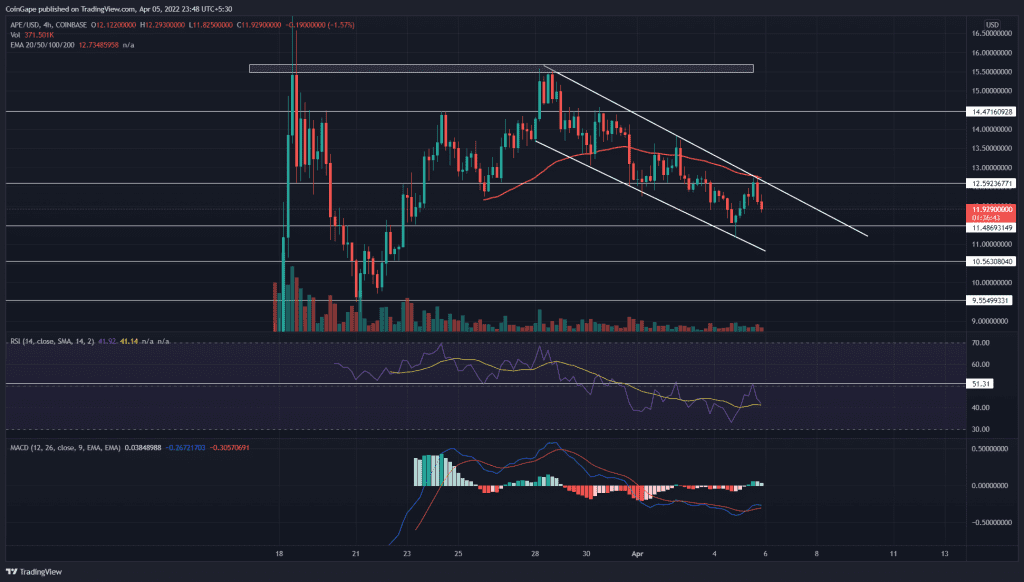
The Apecoin(APE) price showcase a bearish fallout of the ascending triangle in the 4-hour chart, resulting in the $13.5 breakdown. The bearish trend continues in a descending channel pattern and risks the $11.5 mark fallout.
Key points:
- The APE price turns down from the $12.6 resistance with a bearish engulfing candle.
- The 50 EMA act as strong resistance to APE price
- The intraday trading volume in Apecoin is $978.65 Million indicating a 36% loss.
Source- Tradingview
With the fallout of the ascending trendline on March 31st, the APE price fell below the $13.5 mark resulting in the triangle fallout. The downfall continues after retesting $13.5 on April 2nd in a falling channel pattern.
furthermore, the sellers drive the prices below the 50% Fibonacci retracement level in the 4-hour chart and form an accumulation range between the 61.80% level. Furthermore, the price trend shows a bearish resonance resting at $12 and might shortly test the $11.50 mark again.
If sellers crash the $11.5 support zone, the bears will outgrow the falling channel and result in a downfall close to the $10 mark.
Countering the bearish doctrine, if buyers regain trend control and result in an early bullish reversal, a bullish breakout possibility of the falling channel will increase substantially. In such a case, an uptrend to the $14 mark is possible.
Technical Indicator
Despite a lower high formation in APE price action, the RSI slope forms a swing high parallel to the previous one, indicating the rising bullish momentum.
However, the MACD indicator nearing a bearish crossover among fast and slow lines gives additional confirmation for a bearish reversal.
- Resistance levels: $12.6 and $14.7
- Support levels: $11.5 and $10.5


