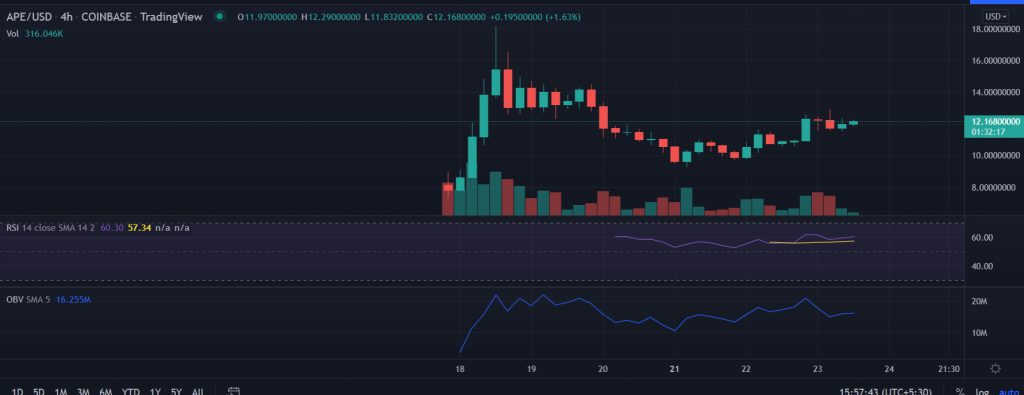
APE price consolidates after the previous session’s massive gains. Furthermore, the price still holds above the crucial $12.0 mark, which hints at the underlying bullish current at the APE price.
- APE price tests swing highs at $12.88 on Wednesday.
- On the 4-hour chart, APE forms a bullish rounded bottom pattern signaling more gains toward $14.50.
- RSI favors the bullish outlook in the coin.
APE price ready to jump
APE price for the past four-session is hovering in a range of $12.80 and $11.50 after surging 40% from the lows of $9.25. However, currently, the price is facing some upside resistance near $12.30, a critical support-turned-resistance level. The APE price must trade above the upper boundary of the mentioned trading range to maintain the upside momentum.
A strong buying pressure with good trading volumes will first test the immediate upside target at $13.35 as there is no stoppage in between.
Furthermore, bulls will flex their muscles to test the highs of March 19 at $14.50.
advertisement
On the contrary, if the price fails to sustain the session’s low then it would meet the downside target placed at $10.58. A spike in sell order might trigger another round of selling toward the horizontal support level at $9.82.
The APE price tested record high at $18.20 on March 18. Since then, the price depreciated nearly 60% to $9.25. The selling intensified as it broke the $12.30 mark. The price formed a ‘rounded bottom’ formation with the recent swing highs of $12.88. A rounded bottom is a bullish reversal pattern, which is formed as the downside pressures comes to exhaustion.
As of press time, APE/USD is trading at $12.15, down 0.81% for the day. The 24-hour trading volume is holding at $2,594,136,485 as per the CoinMarketCap.
Technical indicators:
RSI: The 4-hour Relative Strength Index reads above the average line with a bullish bias. The current reading is at 60.
OBV: The On-Balance-Volume consolidates below the recent highs that support the upside momentum in the price.


