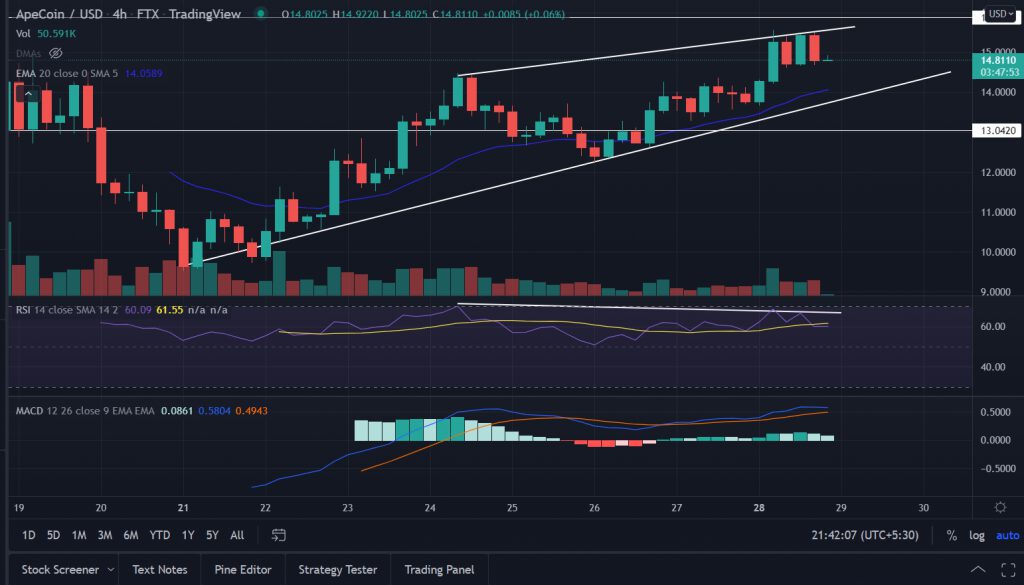
Ape price locks in gains for the third straight day on Monday. However, bulls lack conviction near the higher levels. Further, the technical indicator indicates minor retracement in the price before the continuation of the uptrend.
- APE price prints fresh daily highs on Monday.
- The upside gains capped near $15.50.
- Bearish divergence on RSI indicates minor retracement in the price.
APE price pause gains
Ape price rises along the ascending trend line from the lows of $9.51 with an ascent of 35%. The price tested the bullish slopping line once on March 26, and bounce back to tag the higher level. This, also marked the breach of the vital 20-day EMA (Exponential Moving Average) at $12.85 indicating a bullish underlying current.
Currently, the APE price is facing upside resistance near $15.50 on the 4-hour chart. The formation of alternate green and red candlesticks indicates a struggle between bulls and bears.
If the price breaks below the recent support that emerges near $14.65 then more downside in the token cannot be ruled out.
On moving downside, the APE price would first test $14.0 placed at the bullish trend line followed by the horizontal support level at $13.0 level.
Best optionsEarnEarn 20% APRClaim5 BTC + 200 Free SpinsWalletCold Wallet
Intense selling pressure might expose the lows of March 26 at $12.24.
On the contrary, if the price manages to sustain the session high then it could test the March 18 high at $18.0.
As of press time, APE/USD trades at $14.83, up 4.22% for the day. The 24-hour trading volume of the token stands at $1,523,925,991 according to the CoinMarketCap.
Generally, the rise in price along with rising volume is a bullish sign.
Technical indicators:
RSI: The 4-hour Relative Strength Index showed negative divergence with the price since March 24. Any downtick in the indicator could strengthen the bearish outlook on the price.
MACD: The Moving Average Convergence Divergence holds above the midline with a neutral outlook.


