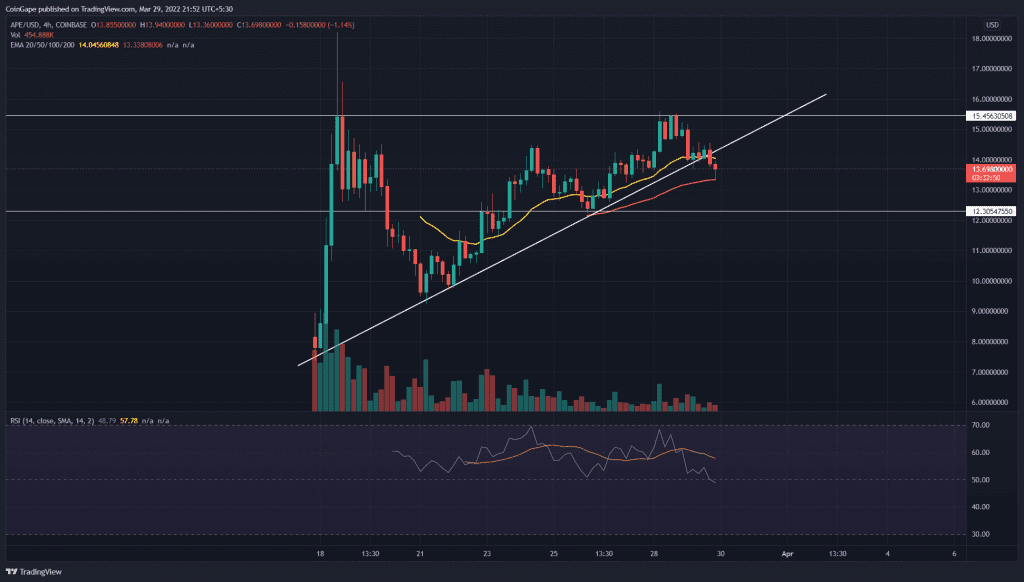
Apecoin(APE) price showcase an ascending triangle in the 4-hour chart since its listing on Coinbase. The prices crawl higher as the pattern comes closer to the breakout point. However, the rising selling momentum triggers a bearish breakdown from this bullish pattern suggesting a revisit to the previous higher low support at $12.6
Key points:
- The APEcoin prices break below the support trendline resulting in triangle fallout.
- The intraday trading volume in Apecoin is $978.65 Million indicating a 36% loss.
Source- Tradingview
With the bearish reversal observed on closing hours on 28th March from $15.50, the APE/USD pair found support at the ascending trendline. As a result, the coin price crawls higher slowly with the help of the support trendline bringing a 2.5% growth.
However, the slithering prices showcase a sudden surge in selling pressure after the Doji candle formations. Therefore, the prices break below the support trendline with a bearish engulfing candle of 3.45%.
Furthermore, the breakdown candle shows a follow-through of 1.83%, which could result in another engulfing candlestick if the selling pressure increases. Hence, a rise in trading volume with higher price rejection from the support trendline will intensify the selling signal.
If sellers crack below the 50-day EMA, traders with bearish sentiment can expect a price fall to $12.5.
Opposing the bearish ideology, if sellers failed to sustain below the breached trendline, the altcoin would reenter the triangle pattern, and the resulting fakeout would drive the price to the $15.45 mark.
Technical Indicator
The sudden downfall has breached the 20-day EMA dynamic support and tags the second line of defense, i.e., 50-period EMA. A follow-up breakdown will accelerate the selling pressure.
However, the RSI slope succumbs under the 14-period average line indicating sellers are taking over the trend control.
- Resistance levels: $15.50 and $18
- Support levels: $14 and $12.5


