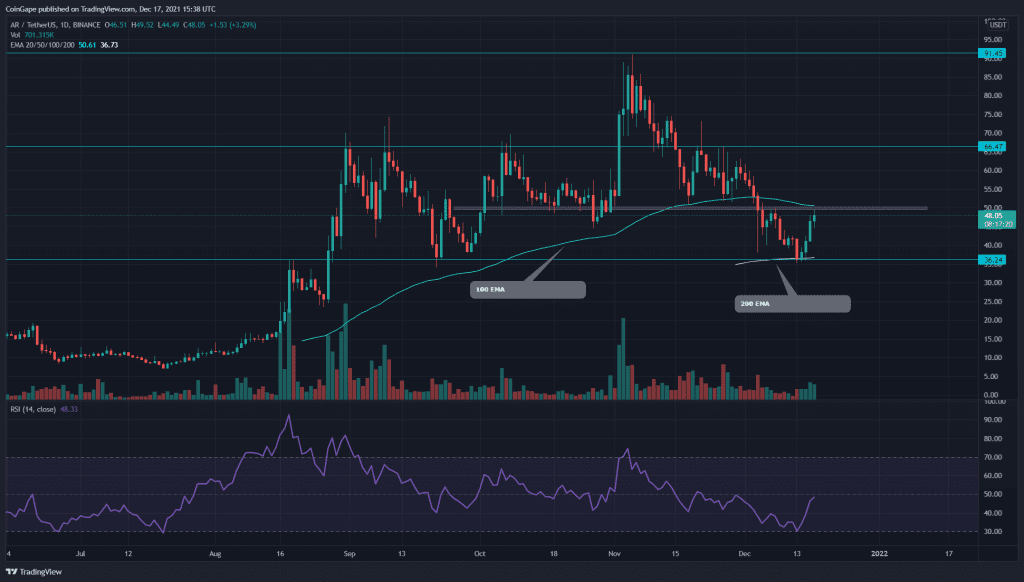
The AR coin displays a short-term downtrend in its technical chart. So far, the price is plunged to the $36.24 support, and after obtaining sufficient support from this level, the coin indicates hints for the recovery phase. The coin seems ready to challenge the overhead resistance of $50, which holds the key for a potential 30% growth.
AR/USD Daily Time Frame Chart
Source- AR/USD chart by Tradingview
Past Performance or Trend-
The AR coin rally entered into a usual correction phase after making a New All-Time High of the $91 mark. However, this retracement extended more than what was expected and plugged the coin to the $36.24 mark, indicating a 60% loss.
AR Coin Hints Bullish Reversal From 200 EMA Support
On December 15th, the AR coin price bounced from the $36.5 mark with a morning star candle pattern. The coin provided a strong follow-up candle displaying a V-shaped recovery in its chart. This little price jump managed to breach a descending resistance trendline, which carried the correction phase from the start.
However, the coin price is currently retesting the overhead resistance of the $50 mark with the hope of a bullish breakout. Reclaiming this crucial resistance, the coin price could rally more than 30%, i.e., till the $66.5 mark.
On a contrary note, if the price fails to overcome the $50 EMA line, the correction phase would continue, and the price could drop back to the $36.2
AR/USD 4-hr Time Frame Chart

Source- AR/USD chart by Tradingview
Technical Indicators-
-The daily Relative Strength Index(45) displayed an impressive recovery similar to the coin’s price action. However, its line is still below the neutral zone, maintaining a bearish sentiment.
-The AR coin price is still moving above the trend defining 200 EMA, sustaining a bullish trend in the price.
-As per the traditional pivot levels of the 4-hr chart, the coin traders can expect the nearest resistance for the AR price at $48, followed by $54.5. As for the opposite end, the support levels are $43.7 and $37.4.


