Disclaimer: The findings of the following analysis are the sole opinions of the writer and should not be considered investment advice
- Litecoin fell beneath $64 and could retest it as resistance
- The $50 area has been held as support for now, but violent moves meant traders must remain cautious
A significant level of fear gripped the market. The momentary depeg of USDT from USD caused panic as users questioned whether Tether was exposed to FTX. Binance backed out of the offer to acquire the exchange, as was their right. The market sentiment alternated between panic at this event, and hope after FTX resumed withdrawals.
Read Litecoin’s Price Prediction 2023-2024
In light of all these events, Bitcoin has seen heavy volatility. Overall, though, it retained a bearish outlook on the higher timeframes. Similarly, Litecoin too took on a bearish bias after it crashed as far south as $50.
Swift recovery from the $50 liquidity pocket, $64 remains the level to watch for bulls
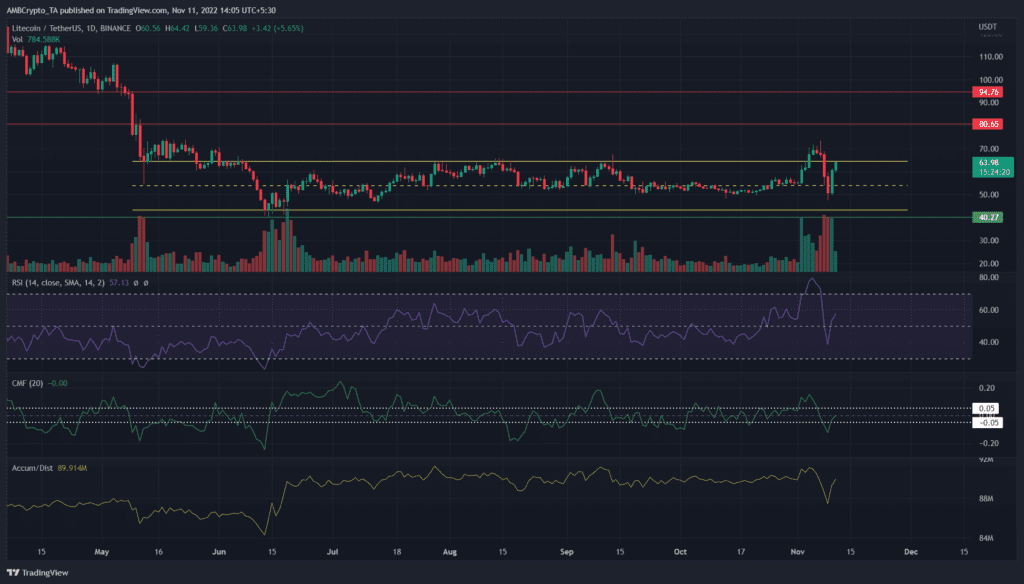
On 4 November, Litecoin broke out of the range (yellow) that it had been trading within since late March. This breakout occurred on high trading volume and affirmed it as a legitimate move driven by high demand.
Events of the past week meant that the bullish euphoria was short-lived. Litecoin saw a sharp reversal on 7 November and retraced as far south as the $50 mark.
This level was both a significant psychological level as well as a zone of support from late August. The huge selling pressure met a brick wall in this zone and saw a quick resurgence back to the range highs at $64.
However, the Accumulation/Distribution (A/D) indicator had not recovered. In fact, it broke beneath the lows it posted in July and August. The inference was that recent days saw huge amounts of selling, and a quick rally might be ripe for fading. The Chaikin Money Flow (CMF) was in neutral territory at the time of writing, while the Relative Strength Index (RSI) showed some bullish momentum still existed.
Longer-term investors of Litecoin can wait for a retest of the $50 area to look to buy. Meanwhile, lower timeframe traders can seek opportunities to short the retest of the $64 resistance.
Dormant circulation marks a local top as transaction volume soars

Source: Santiment
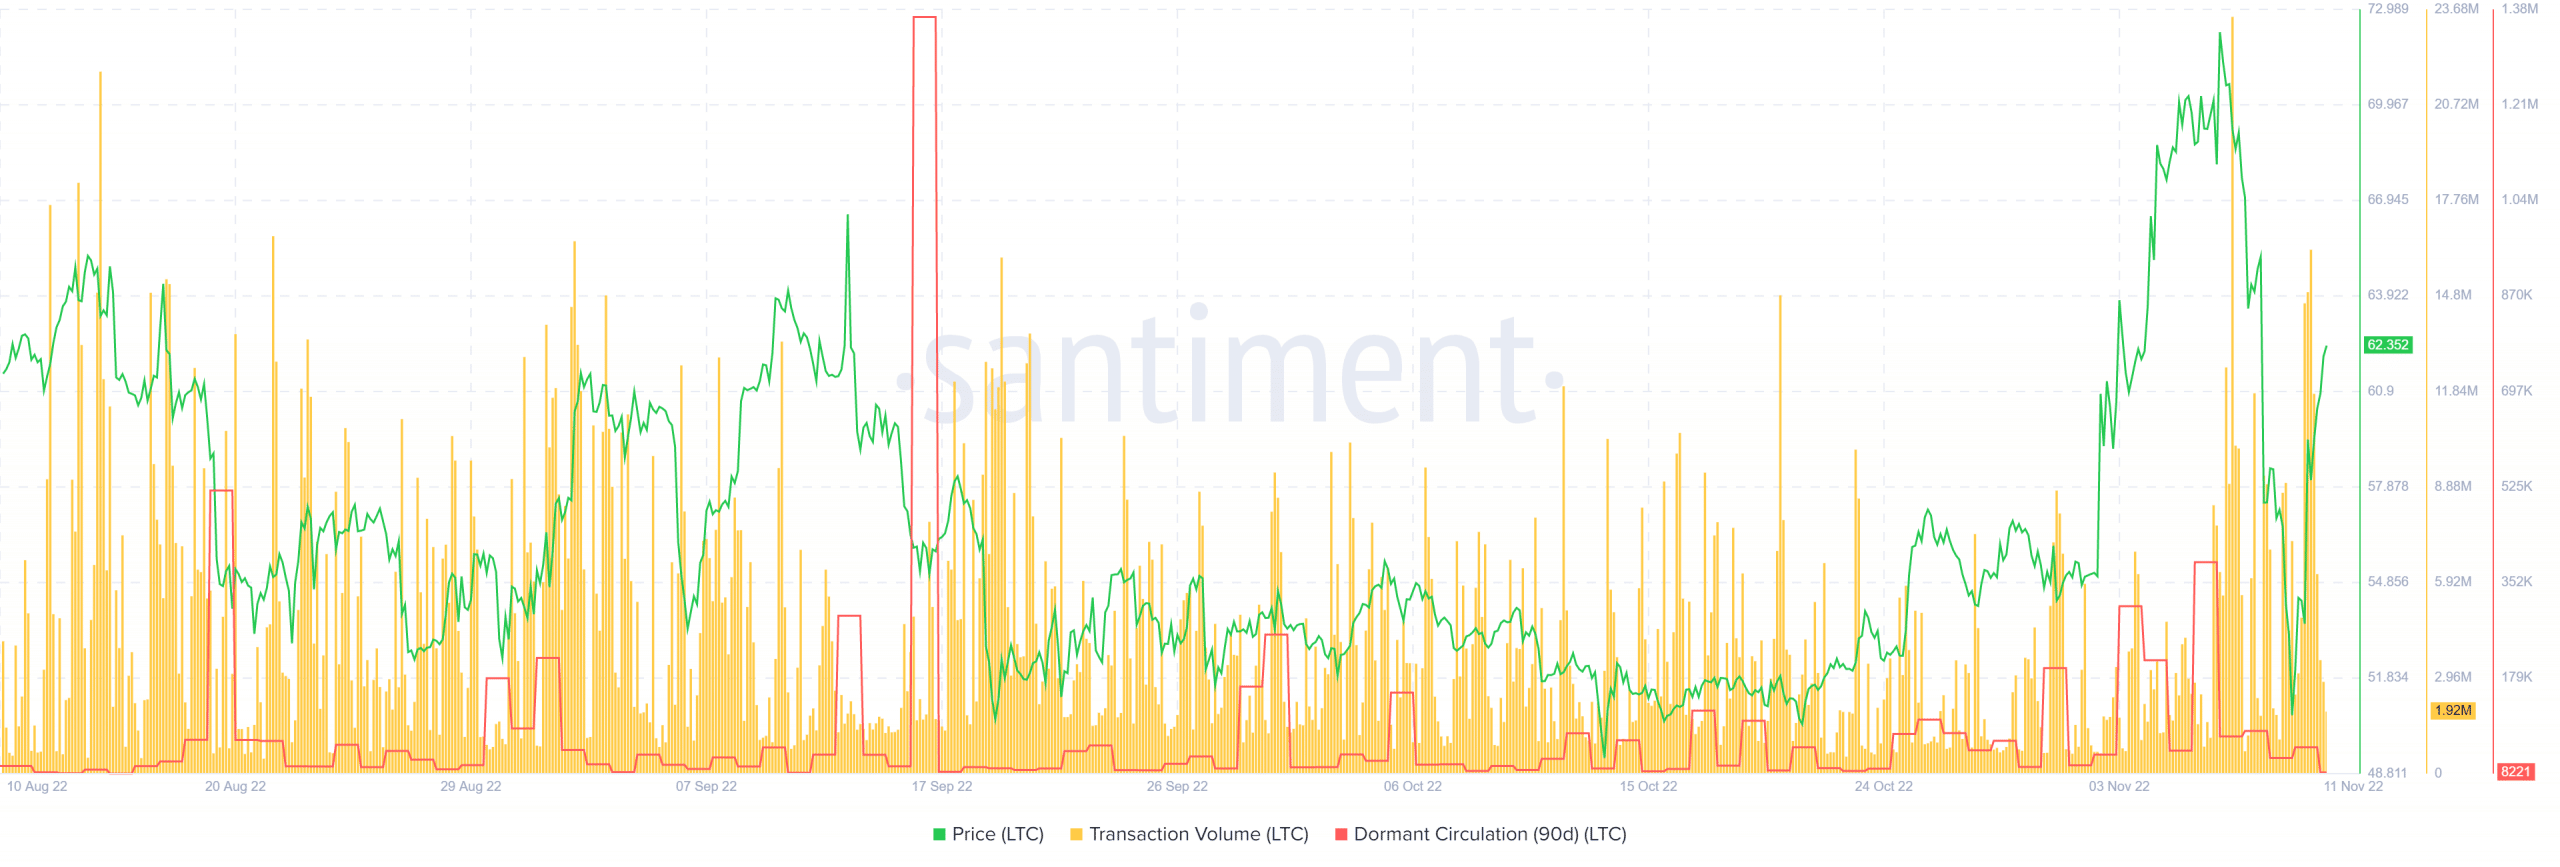
Santiment data showed 7 November saw enormous amounts of Litecoin transacted. A three-hour stretch on that day saw 23.44 million coins transacted. In the past, such sharp upticks in volume have tended to mark the local high or the low, and LTC reached $70 on that day.
Once again the LTC transacted metric rose on 11 November – could this mark yet another local top? In a similar fashion, the 90-day dormant circulation of LTC saw a spike on 6 November. Such upticks, once more, tend to mark local tops as heavy selling pressure follows a gain in dormant circulation. In the past couple of days, a spike in this metric was not seen.
Bitcoin witnessed strong resistance at the $18.2k-$18.6k belt and already tested this region bearishly in recent hours. Another leg beneath $17k could see BTC sink to $15.8k once more and drag Litecoin down with it. $50 and $40-$43 were places where a buying opportunity might arise.


