Disclaimer: The information presented does not constitute financial, investment, trading, or other types of advice and is solely the opinion of the writer.
Bitcoin [BTC] climbed past the $20k mark, but even at the time of writing, the price dipped back to $19.9k. This highlighted how important a resistance of $20.2k-$20.8k was for BTC. Cosmos [ATOM], like many other altcoins, has a habit of climbing higher on the charts alongside Bitcoin. Therefore, any weakness from the king would likely be reflected in the price action of ATOM itself.
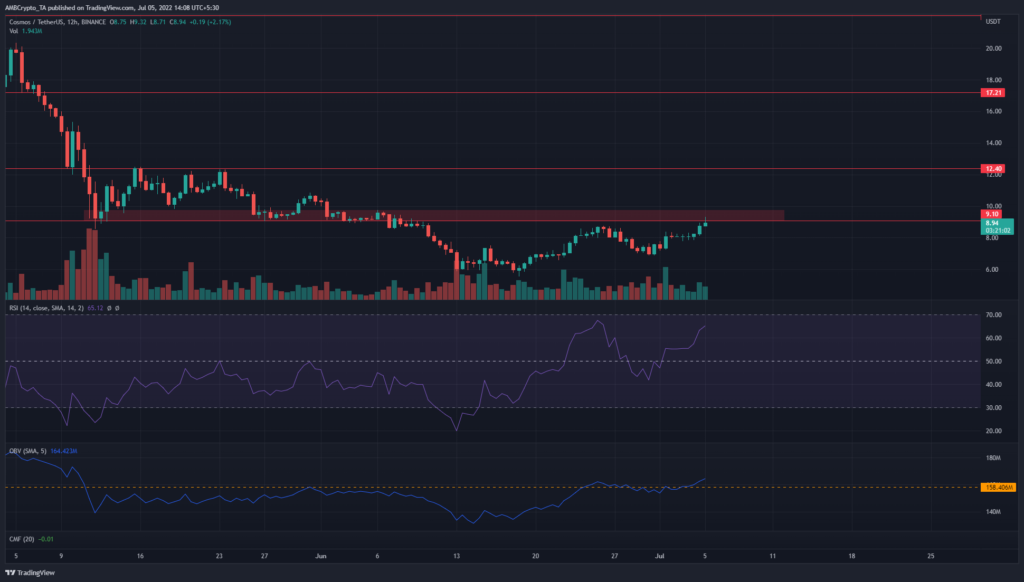
ATOM- 12-Hour Chart
On the 12-hour chart, it can be seen that the past two months of trading have been part of a steady downtrend. Even though ATOM managed to bounce from $5.55, the longer-term trend remained unchallenged.
In order to flip the bias from bearish to bullish, the price would have to climb past $10 and retest the $9.5 area as a demand zone. The Relative Strength Index (RSI) was above neutral 50 to show that the past few weeks had some bullish momentum.
The On-Balance Volume (OBV) had also crossed above resistance from mid-May and suggested that demand was behind the rally from the $6 zone.
ATOM- 4-Hour Chart
On the four-hour chart, the entire area from $8.7-$9.5 has seen significant trading activity early in June. This demarcated this area as a zone of supply where sellers would likely be strong.
At the same time, the past three weeks have seen ATOM form a series of higher lows and higher highs on the price charts, suggesting a bullish move. Yet, would this initiate an uptrend, or was this a pullback before another slide downward for ATOM?
The higher timeframe charts showed that ATOM would need to climb above $10 and $12.4 to flip the bias from bearish to bullish. In the meantime, bulls would want to see the $8.6 area (cyan box) defended, and would be anticipating a move toward the $9.5 mark.
Bullish market participants can find the price charts encouraging. The RSI backed up their bullish notion, and was well above the neutral 50 and showed an uptrend in progress in the past week. However, even though the price made a higher high above $8.6, the OBV was unable to push higher.
In fact, the OBV remained flat over the past week, as did the Chaikin Money Flow (CMF). This suggested a lack of buying pressure behind ATOM’s rally.
Conclusion
Cosmos has seen buyers in the past few weeks, but they appear to be fighting an uphill battle. The $8.6 area presented an attractive, relatively low-risk opportunity to buy Cosmos. A stop-loss below $8.4 can be set, and a retest of the demand zone can be a buying opportunity.
Yet, the volatility of Bitcoin could catch traders unawares, and careful position sizing would be key to risk management.


