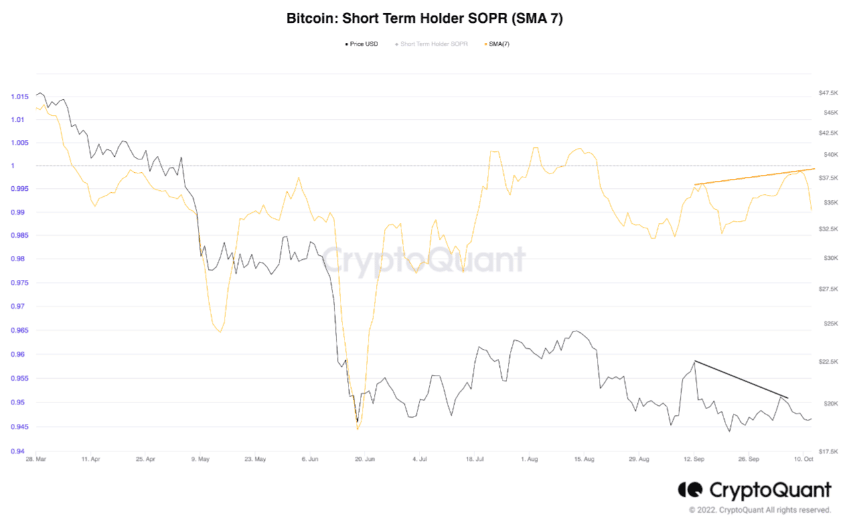
Bitcoin [BTC] short-term investors have been the biggest beneficiary of the consolidation between $19,000 and $22,000 in the last few months. This position was made known by Chartoday, a CryptoQuant analyst.
According to his analysis on the CryptQuant website, BTC short-term holders have not recorded significant losses since June.
Here’s AMBCrypto’s Price Prediction for Bitcoin [BTC] for 2022-2023
Additionally, the analyst noted that long-term holders had played a part in bringing down the BTC price. Additionally, there could be no respite soon, as there were clear indications of a bearish divergence.
Despite that, short-term traders have witnessed some gains, as revealed by the Spent Output Profit Ratio (SOPR). As for long-term investors, they were at risk of further capitulation.
Throwback time?
However, the SOPR was not the only factor for the current BTC state. Chartoday added that BTC could follow the 2018 capitulation trend when the king coin dropped from $6,000 to $3,000. The fact that the Miner Position Index (MPI) was only a little above the June 2022 capitulation revealed that BTC was at risk of further decline in the mid to long term.
At press time, the long-term SOPR showed that BTC was already preparing for more capitulation. Based on CryptoQuant data, the long-term SOPR, which indicated profits at 1.436 on 18 October, took a significant fall.
At press time, the SOPR stood at 0.525. With the decline, it was doubtful that BTC’s long-term investors were in for any substantial profit in the coming month. More so, this seemed to agree with the analyst that these investors were reluctant to top up their BTC portfolio.
What will stop this stormy weather?
Despite the inconsistent BTC price, futures traders had maintained an interest in trading the coin. According to Glassnode, the futures volume across all exchanges had risen from its 19 October decline. At press time, the volume was $25.82 billion.
This increase indicated that BTC traders were confident of profits despite the BTC price at $19,162. While there has been a renewed interest, recent liquidations could not match up with the previous 24 hours. Still, long-positioned traders might not make most of the profits from the derivatives market.
However, the BTC/USD chart might have other opinions. Based on the four-hour chart, BTC was likely to maintain a bearish momentum in the short term. This was because the 20-week Exponential Moving Average (EMA) in blue was well below the 50 EMA (yellow). In the longer 200-week period, investors might have experienced some respite. With the 200 EMA rising above the 20 and 50 EMA, BTC might be bullish at some point. Hence, long-term holders might not need to lose hope on a recovery.


