Avalanche (AVAX) is at risk of falling below a crucial support level that has been in place since Nov 2021. This would indicate that the trend is bearish.
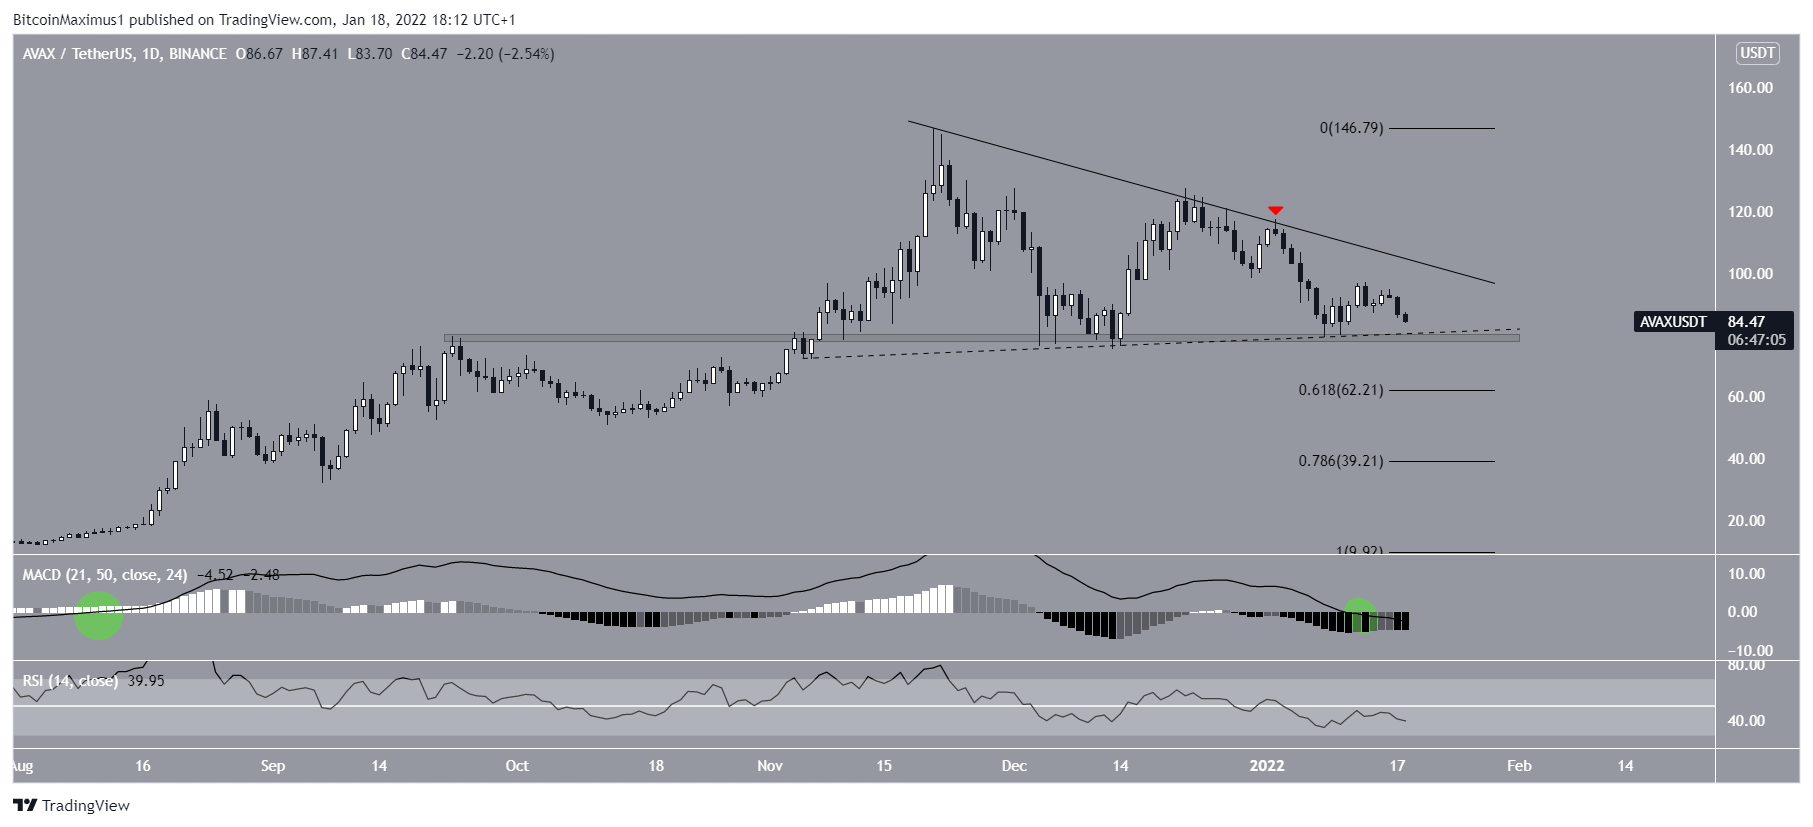
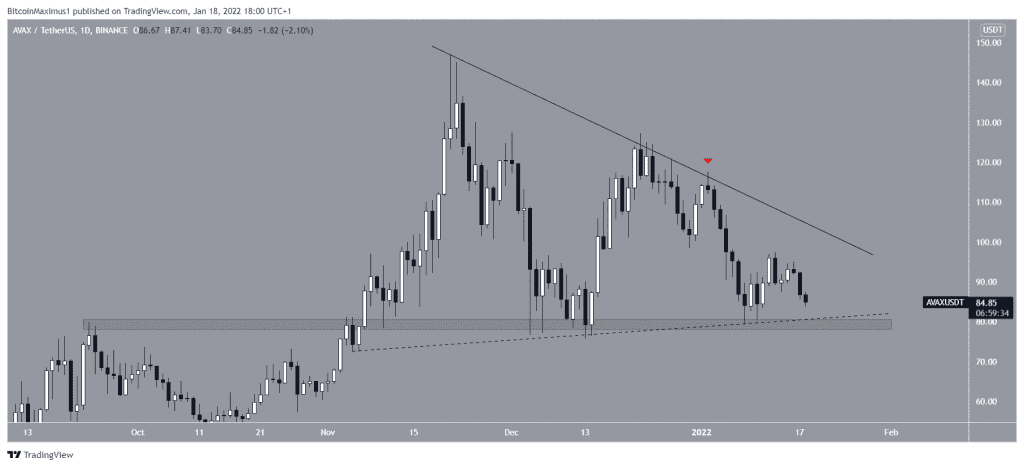
AVAX has been decreasing alongside a descending resistance line since reaching an all-time high price of $147 on Nov 21. So far, the triangle has rejected the token thrice, most recently on Jan 2 (red icon).
Despite the rejection and subsequent decrease, AVAX has created a strong support level at the $80 horizontal support area, which previously acted as the all-time high resistance. When combined with the descending resistance line, this would create a descending triangle, which is considered a bearish pattern.
However, it is also possible that AVAX is following an ascending support line (dashed), which would create a symmetrical triangle. This is considered a neutral pattern, so both a breakout and breakdown would be possible.
Future movement
The possibility of a downward movement is also supported by technical indicator readings, especially the MACD.
The MACD is created by a short- and a long-term moving average (MA). Currently, both the signal line and the histogram are negative. This means that the short-term MA is slower than the long-term one. It is a sign often associated with bearish trends.
The previous time it occurred was on Aug 2021 (green circle), when the AVAX price was close to $20.
Furthermore, the RSI, which is a momentum indicator, is below 50. This is also a sign of bearish trends.
If a breakdown transpires, the closest support area would be at $62. This is the 0.618 Fib retracement support level.

AVAX wave count
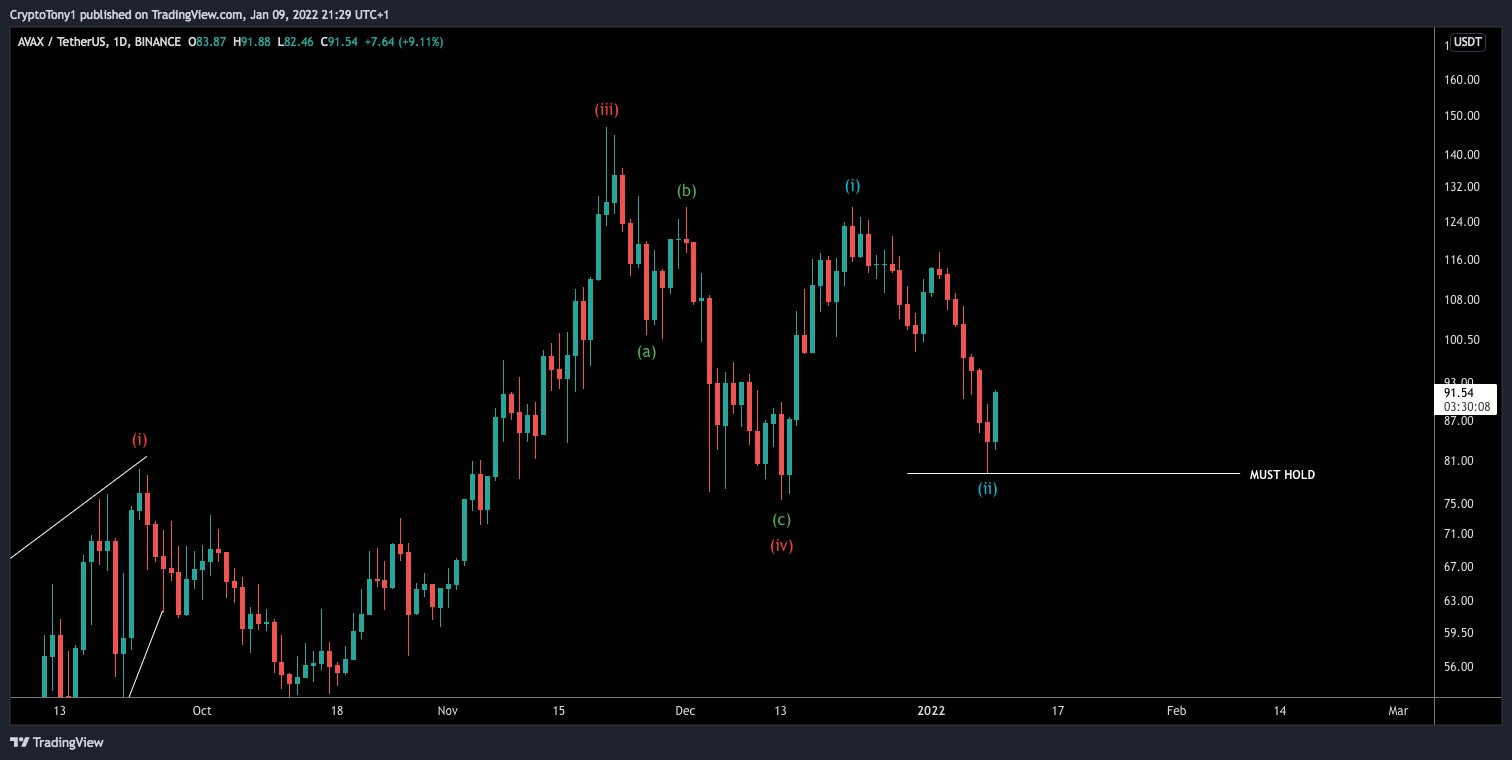
Cryptocurrency trader @CryptoTony_ tweeted an AVAX chart, stating that if the Jan 7 low holds, it is possible that the token will continue increasing towards a new all-time high.

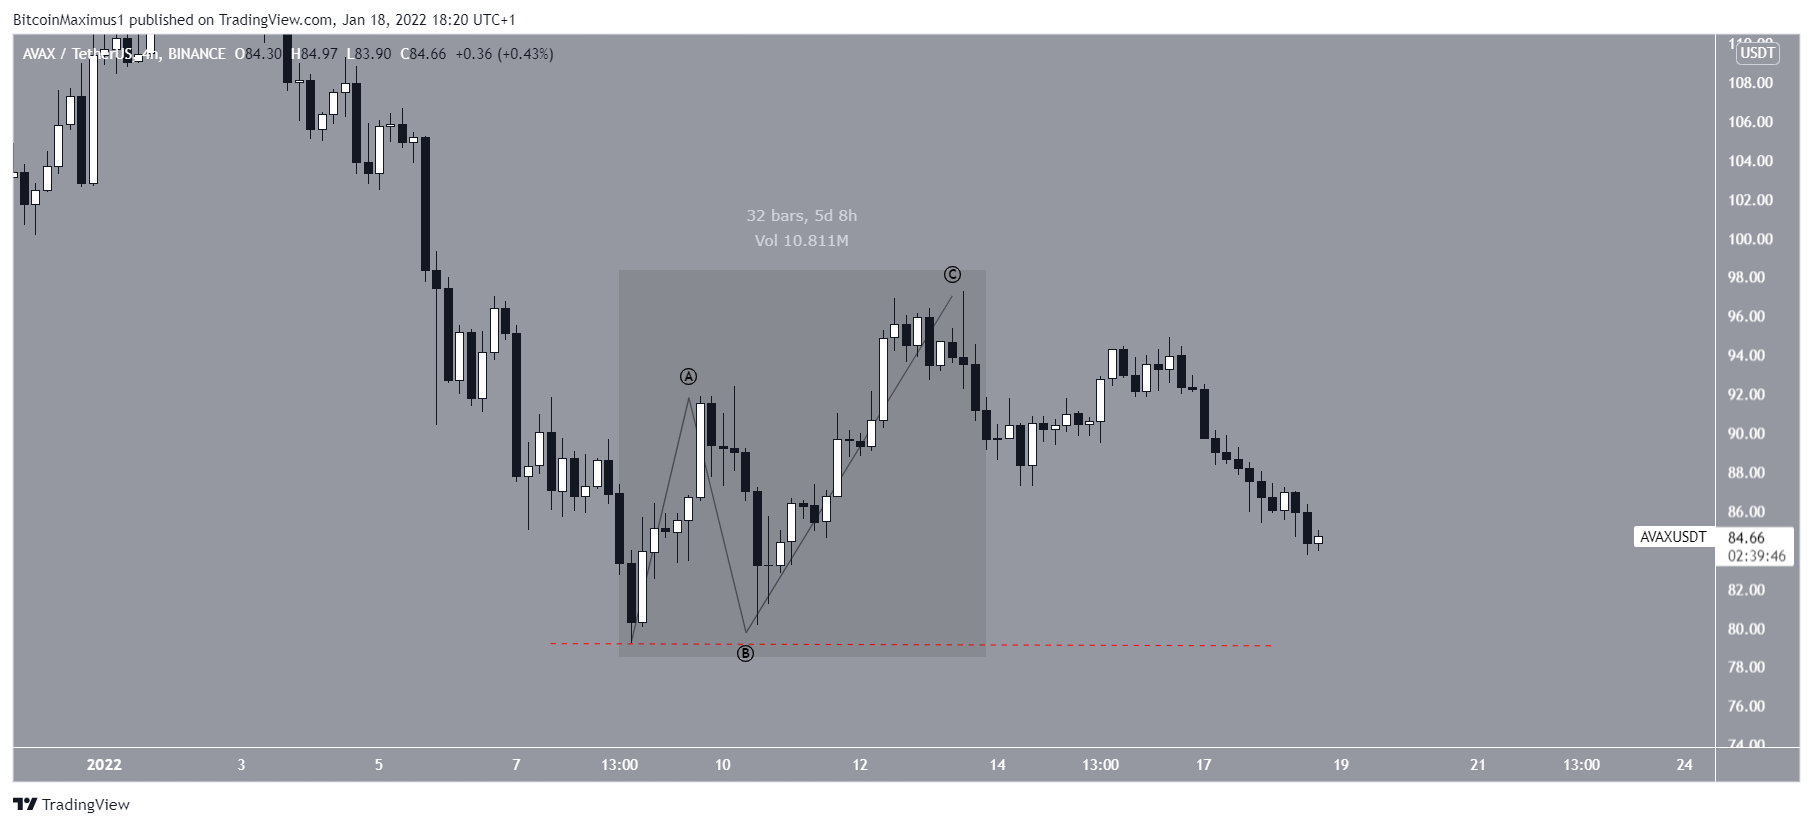
If the correction ended with the Jan 7 lows (red line), the ensuing increase would be expected to be a five wave upward movement. However, the increase has been a three wave structure (highlighted).
Therefore, it is more likely that the AVAX trend is still bearish, and the token will eventually break down.

For BeInCrypto’s previous Bitcoin (BTC) analysis, click here.
Disclaimer
All the information contained on our website is published in good faith and for general information purposes only. Any action the reader takes upon the information found on our website is strictly at their own risk.


