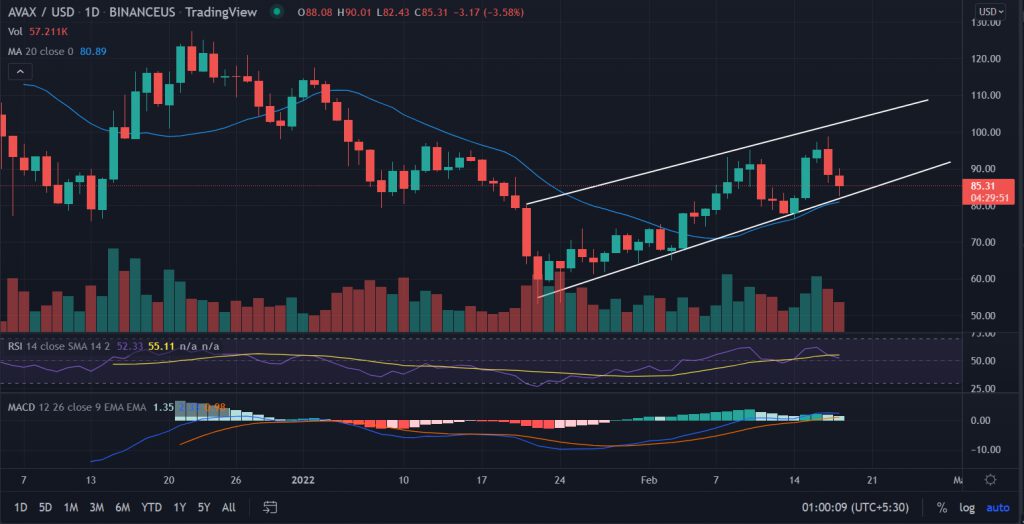
Avalanche (AVAX) price falls for the second day on Friday. AVAX price fails to sustain Thursday’s high and lost 18% in two days. Investors anticipate a retracement of 15% towards $0.68 if the bearish sentiment persists. However, the current price trend suggests that AVAX could utilize the current retracement as a base for the next leg up.
- Avalanche (AVAX) price edges lower on Friday in the late U.S trading session.
- Investors manage to hold above the critical $80 level.
- AVAX logged nearly 85% gains from January’s lows.
As of press time, AVAX/USD is trading at $84.98, down nearly 4%. The 24-hour trading volume reads at $1,419,047,712 with more than 22$ losses.
AVAX seeks next leg-up
On the daily chart, Avalanche’s (AVAX) price has surged more than 80% from the lows of $53 made in late January. The price action constitutes a ‘rising wedge pattern’, which is a bearish continuation pattern.
That’s a twist, as per the extension of the formation AVAX has the potential to rise further 37% from the current levels. A closer look at how the price performed inside the channel strengthens the short-term bullish bias for the pair.
Bulls have found fresh buying opportunities as the AVAX price tests the lower trendline of the mentioned formation at every retracement.
Now, AVAX/USD has comfortably placed above the 20-day Simple Moving Average (SMA) at $80.00 that coinciding with the current retracement in price.
We expect, the price would respect the reliable support level and would take out the first resistance hurdle at $103 followed by the ultimate target of $ 110.0.
Alternatively, a failure to hold $80.0 on a daily closing basis would invalidate the bullish theory. The first downside target could be found at $70.0.
Technical indicators:
RSI: The Daily Relative Strength Index (RSI) slips below the average line. However, still reads at 50 making bulls hopeful.
MACD: The Moving Average Convergence Divergence (MACD) is above the midline. Any uptick in the indicator would be favorable for long positions holders.


