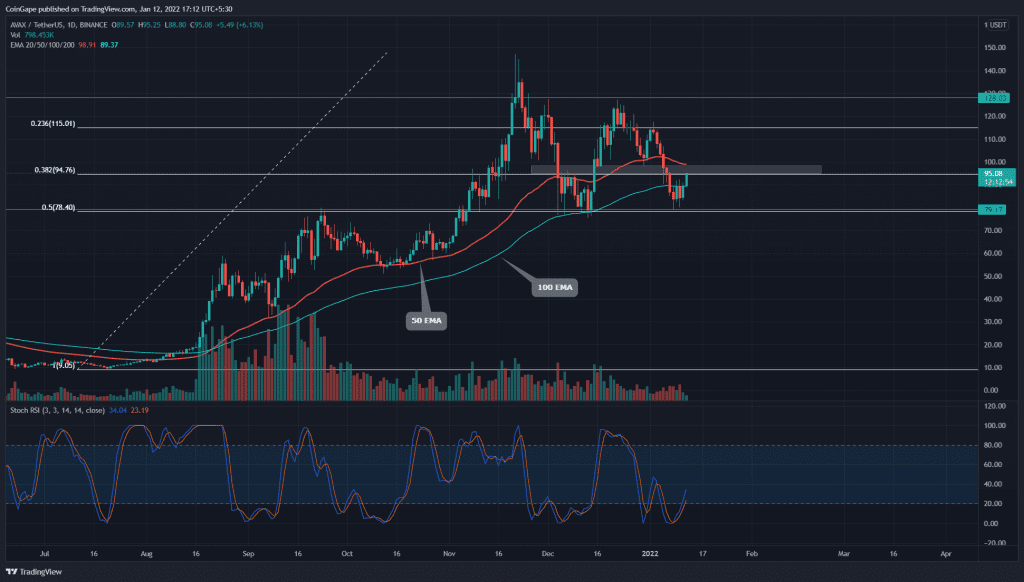
The Avalanche (AVAX) price faced a constant bear attack right from the start of 2022. The coin lost nearly 37% from the previous swing high of $128 and dropped to the 0.5 FIB support(79.2). The technical chart shows reversal signs from this support, hoping for a recovery rally.
Key technical points:
- The AVAX coin bulls reclaim the 100-day EMA
- The daily-Stochastic RSI provides a bullish crossover of the K and D line
- The intraday trading volume in the AVAX coin is $858.8 Million, indicating a 19.2% loss
Source- Tradingview
The last time when we covered an article on Avalanche coin, this pair indicated an impressive recovery rally, aiming for the All-TIme High resistance of $147. However, the price faced intense supply from an in-between resistance of $128, resulting in a bearish crossover.
Thus, the price started to drop again and plunged back to the 0.5 Fibonacci retracement level. The coin price spent a few days trying to identify enough demand pressure from this support before presenting this slight hint for reversal.
The recent bloodbath in the crypto market had engulfed the crucial EMA levels(20, 50, and 100). The price is still trading above the 200 EMA, presenting an overall bullish outlook for this coin.
The Daily-Stochastic RSI shows the K and D lines offer bullish crossovers, providing more confirmation for a bullish reversal.
AVAX Price Shows A Double Bottom Pattern In The 4-hour Time Frame Chart

Source- Tradingview
The AVAX price forms a double bottom pattern from the base of $79.2. The coin price is quite close to the resistance neckline of $98.2. Once the price shows a decisive breakout and sustainability above this level, the crypto traders can look for a long opportunity.
The Relative Strength Index(63) shows a striking pump compared to the price action, indicating the increasing underlying bullishness of the coin.
The Supertrend indicator turns greens as the price shows a steady rally in this lower time frame chart.
- Resistance levels- $98.2, and $117
- Support levels-$86 and $79.2


