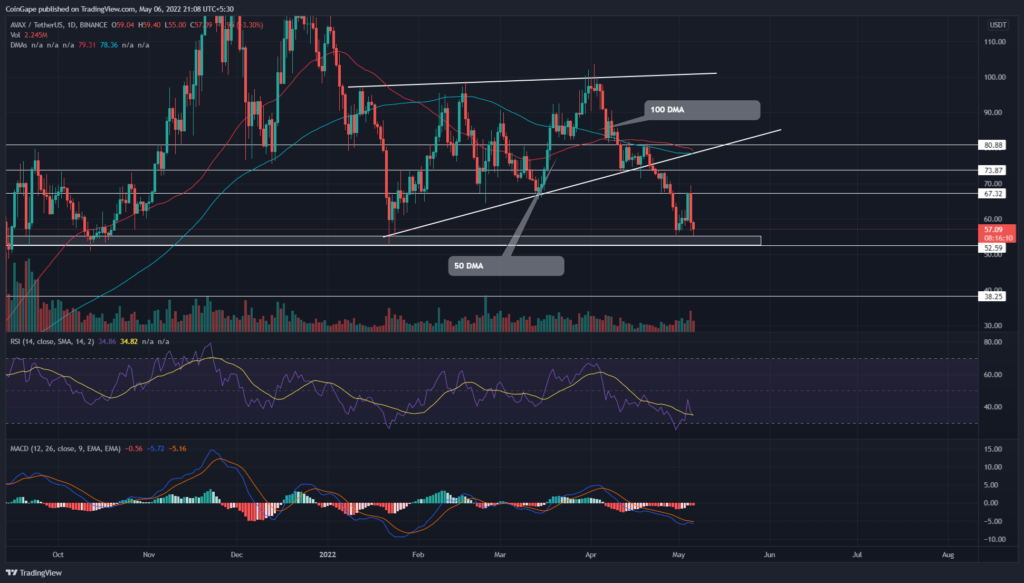
A fallout from the ascending wedge pattern signaled the continuation of the ongoing correction. Therefore, the aggressive selling from the traders breached the $67 local support and sank the (Avalanche)AVAX price to $55-$52 support. However, a bullish divergence in the RSI chart indicates the rising demand pressure at this support.
Key points:
- The 20 DMA implies constant resistance to the AVAX price
- The RSI-slope shows a significant gap in its bullish divergence
- The intraday trading volume in the AVAX is $1.27 Billion, indicating an 11.5% gain
Source- Tradingview
On April 21st, the (Avalanche)AVAX price offered a fallout from the 3-month-old ascending wedge pattern. Furthermore, the post-retest fall has tumbled the altcoin by 25% and plunged it to multiple months’ support of $55-$52.3 support.
Previously, this support level initiated the November 2021 and Jan-Feb 2022 bull rallies. Therefore, the traders can consider it a strong accumulation zone, providing an excellent opportunity for a long trade.
If the AVAX chart provides a bullish reversal sign at this support, traders can enter a long trade with a stop loss below the psychological mark of $50. Furthermore, the potential rally could retest the 21% higher mark of $67.3, followed by $73.
Trending Stories
On a contrary note, a daily-candlestick closing below the $52 would invalidate the bullish thesis and continue the correction rally 23% lower to $40.
advertisement
Technical indicator
EMAs- The downsloping 50-day EMA nearing a death crossover with 200-day EMA attracts more selling in the market.
MACD indicator– the MACD and the signal line are drawn quite close to each other, suggesting a potential bullish crossover. This buy signal would encourage more buyers in the market.
RSI- the RSI slope shows an evident bullish divergence in the coin chart, indicating a high possibility of a bullish reversal
- Resistance levels- $67, and $73
- Support levels- $52 and $40


