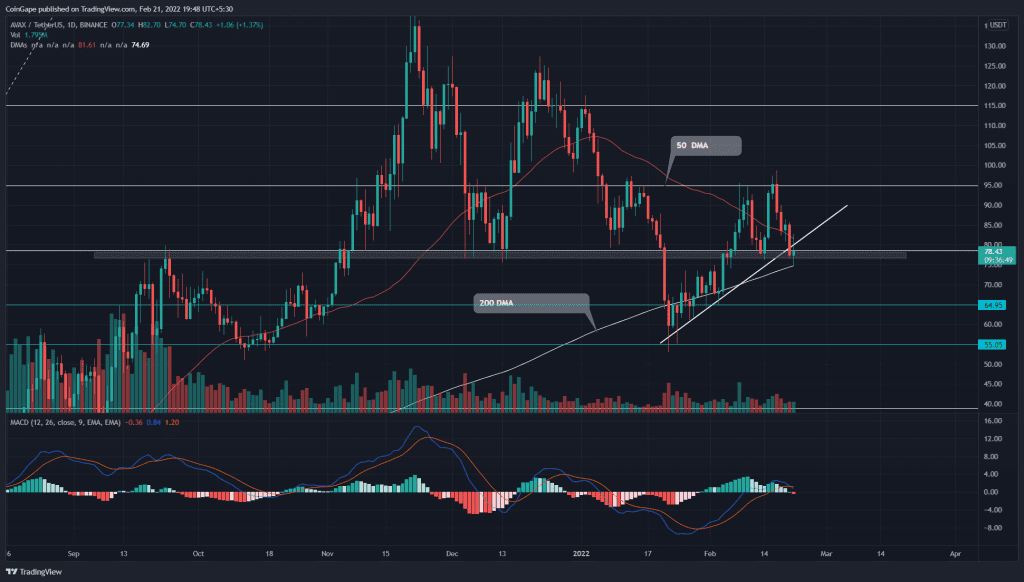
The AVAX price second rejection from the $95 mark implies the traders hold a sell-on-rally stance. The AVAX price trading at the $77.5 mark registered a 16.5% fall in the last four days. Moreover, the fallout from the $78 suggests the completion of the double bottom pattern, supporting further selling.
Key technical points:
- The recent sell-off in the crypto market has engulfed the 20 and 50 DMA
- The intraday trading volume in the AVAX is $1.2 Billion, indicating a 33.4% hike
Source- Tradingview
The AVAX price turned down from the $95 mark on February 17th, indicating the sellers are aggressively defending this resistance. Moreover, the resulting downfall displays a double bottom pattern in the daily time frame chart.
The technical chart displays a confluence of major technical levels at $78 along with a 0.5 Fibonacci retracement level and upcoming support trendline. On February 20th, the sellers gave a decisive breakdown from this crucial support, triggering a short-entry opportunity.
The Daily-MACD indicator shows a bearish crossover of the fast and slow line, projecting a sell signal. Moreover, these lines can soon slip below the neutral zone, suggesting the bears have overpowered bulls.
Is More Pain to Follow?

Source- Tradingview
Following the breakdown, the AVAX price pulled back to retest the new flipped resistance($0.78). By the press time, the coin chart shows a higher price rejection candle at this level, indicating intense supply pressure.
The sustained selling would tumble the AVAX/USDT pair by 14%, bringing it to $65. If bears plunge the pair below this support, the selling pressure would intensify and sink the altcoin to January low($55).
However, the coin price currently retests the 200 DMA, which could defend buyers from further decline. If they succeed, the buyers would drive the altcoin to $95 resistance.
Resistance levels- $95, and $115
Support levels-$65 and $55


