Published 42 mins ago
The Avalanche price analysis shows a probable bounce bank in the price for the day. The price is trading in the green for the past few hours. The recent market structure points to a rise in the near future. The vital support for AVAX price is found near the $22.50-$22.80 zone.
advertisement
At the time of writing, AVAX is trading at $22.80 with more than 1% gains. The latest market capitalization surged to $6.5 billion. The 24-hour trading volume is registered at $419,189,464, a 12% decline. Thus, the recent bounce back needs more confirmation to rely on.
- AVAX price edges higher following the consolidation.
- The price hovers near the key support area at around $2.80, a bullish hammer formation supports a bounce back.
- However, a daily candlestick below $22.50 could be a warning sign for the bulls.
Avalanche price looks stable

The Avalanche price analysis indicates a mild bullish sentiment for the day.
The price moved in a “Rising Channel” pattern, forming higher highs and lows since June 18. Further, AVAX has completed a ‘Round Top’ formation, where the price is currently hovering.
Trending Stories
A bullish hammer formation gives handsome upside gains.
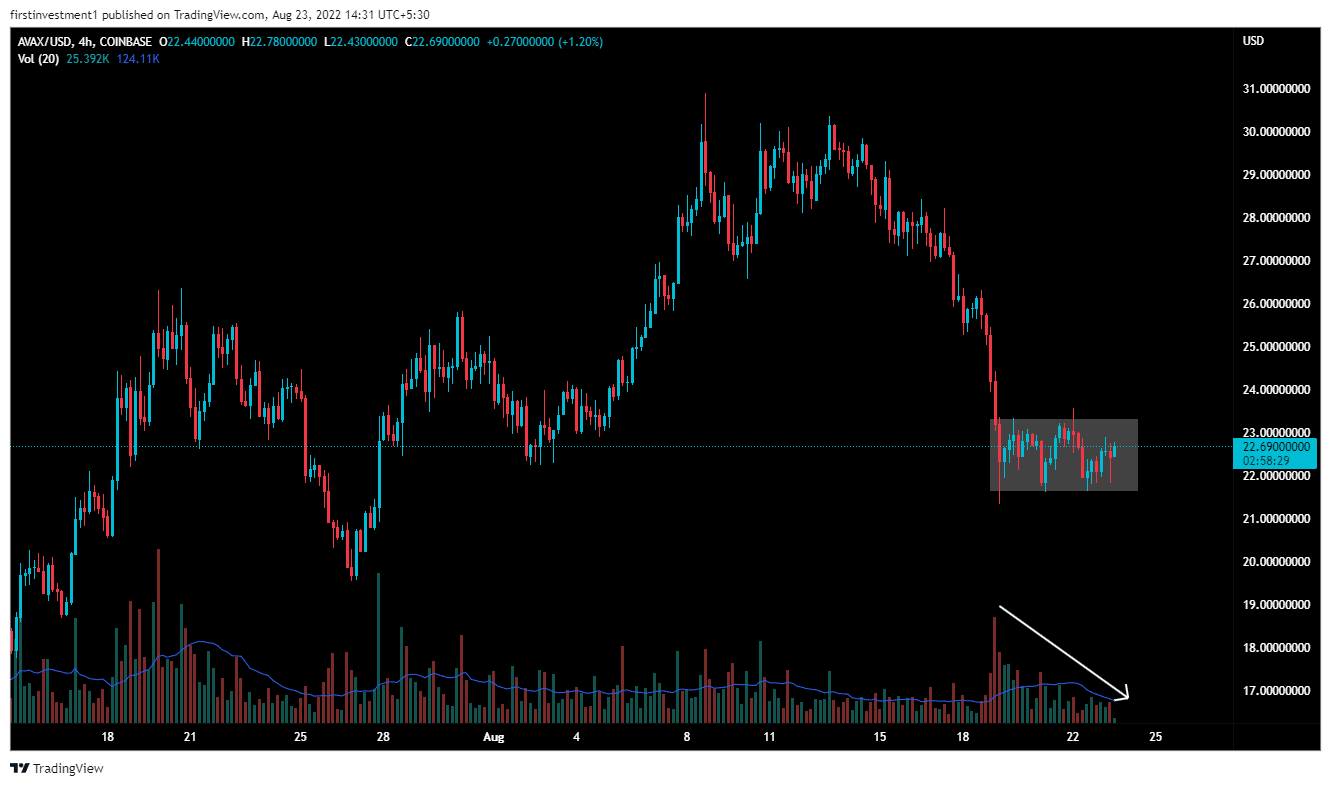
The price has been consolidating near its support level for the last four days, with declining volumes. The volumes are below the average line and falling, with the price moving sideways, implying accumulation near support.
On August. 19, the bearish candle tested the support line, with more than average volumes, implying big money is slowly exiting a short position. However, the sellers seem to be exhausted near the lower levels as the price stabilized.
A daily close above the critical $23.50 could produce more gains. If that occurs, the first upside target could be $26.0 followed by the highs of August 16 at $28.20.

In the four-hour time frame, the price is consolidating in the range of $21.35 to $23.75. After giving a bearish impulse move, the price started to accumulate in the mentioned range. Once the trading range breaks above the resistance line amid renewed buying momentum, the big players might enter into fresh long trades.
The nearest support is the swing low, which is $21.33, whereas the nearest resistance could be found at $23.77. There is a higher probability of the price breaking the resistance level. “Buying on dips” is the best course of action we can go with.
On the other hand, a sustained selling pressure below the $22.50 level could invalidate the bullish outlook. And the price can move toward $21.50. Further, the stoppage could be the horizontal support near $20.0.
advertisement
AVAX looks slightly bullish on all time frames. Above $23.50 closing on the daily time frame, we can put a trade on the buy side.
Share this article on:
The presented content may include the personal opinion of the author and is subject to market condition. Do your market research before investing in cryptocurrencies. The author or the publication does not hold any responsibility for your personal financial loss.


