Disclaimer: The information presented does not constitute, financial, investment, trading, or other types of advice and is solely the opinion of the writer.
Avalanche has been quite bearish on the charts, but on lower timeframes, the $28 and $24 levels have been important support levels in the past two weeks. At press time, Avalanche was trading beneath both these levels and offered an opportunity to enter a short position on the coin.
Bitcoin lacked bullish strength as it bounced weakly from the $28.7k support level. Ethereum was also shedding value, and if these two market leaders see a strong move downward, AVAX is bound to follow swiftly.
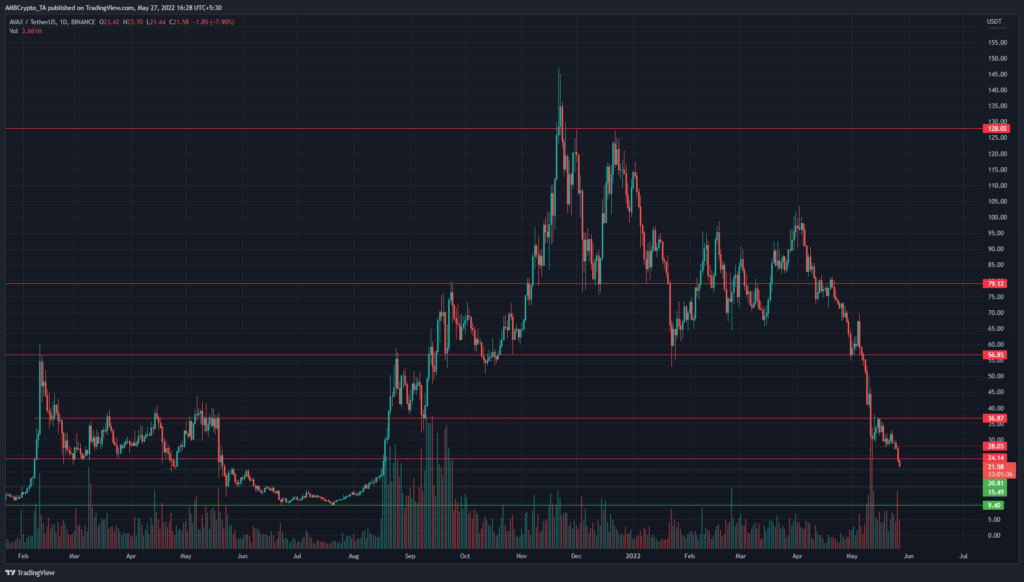
AVAX- 1 Day Chart
On the daily chart, it can be seen that the price has set a series of lower highs since November. The market structure flipped to bearish in January when the price slipped below the $79.8 mark after setting a lower high in December.
In late March, the price rallied to $100 once again but this did not lead to the bullish breakout that buyers might have hoped for. Instead, a firm rejection at $100 was followed by a near 80% drop in April and May.
The price still has not entered a phase of accumulation, and further lows could be seen after a session close below the $24 mark.
AVAX- 4 Hour Chart
A set of Fibonacci retracement and extension levels (yellow) was plotted based on AVAX’s drop from $69.52 to $23.51. At the time of writing, the price dropped below the $23.51 level once again. This meant that the price was quite likely to continue further south, and head toward the 23.6% extension level at $12.65.
Before $12.65, there are two other levels of important support at $20.81 and $15.6 which AVAX could see a bullish reaction. The $20.8 level acted as support in April 2021 but was retested as resistance in June, while $15.6 served as support in May, but was flipped to resistance in June as well.
The drop last year took the price to $9.4, and another such drop can not be discounted yet for Avalanche. After all, many once-popular altcoins have been known to drop 80%, and then yet another 80%.
Going level-by-level, the confluence of support at the $23-$24.5 area has been broken, and hence the bias remains bearish. The price could bounce all the way to $25 and still not change the bias. However, a move to $26 could indicate the need to cut the trade and reassess market sentiment.
The RSI was below 30 and showed a value of 22.69 on the 4-hour chart, which was extreme bearish momentum. The CMF was also beneath -0.05 to show significant selling pressure, and the OBV also dived beneath the lowest level it had been over the past week. Put together, the indicators on the lower timeframe showed the strength of the bears.
Conclusion
A retest of the $23 level can be used to enter short positions, with the risk being a maximum of 2% of trading capital, or even lower as per trader risk appetite. The stop-loss lies at $26.04, 13.2% above the entry mark, while the $15.6 can be used to take profit.
If AVAX drops below the $22 mark and reaches the $20.81 support level, the stop-loss can possibly be brought to break-even and partial take-profit can also be done based on market conditions.


