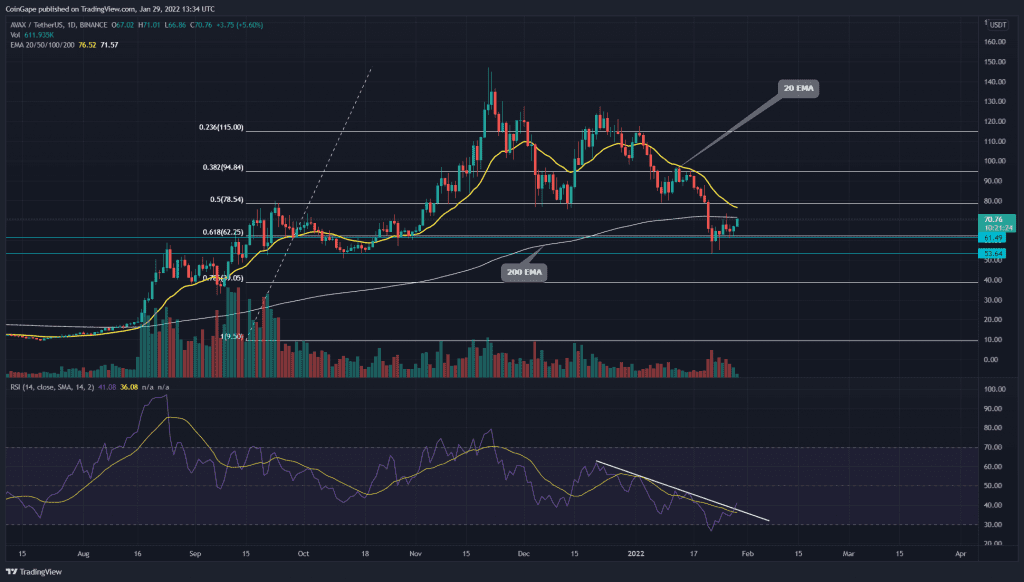
January has been a significant correction phase for AVAX price. The coin price lost around 50% in a month and plummeted to $53.6 support. The current relief rally in the AVAX/USD pair has formed an inverted flag pattern, extending this downfall.
Key technical element to ponder
- The 20-day EMA line offers dynamic support to AVAX price
- The RSI slope shows an impressive recovery in the daily chart.
- The intraday trading volume in the AVAX Network coin is $1.81 Million, indicating a 20% loss.
Source- Tradingview
The last time we covered an article Avalanche coin, the AVAX price showed a relief rally to the $97 resistance. However, the sudden sell-off in the crypto market violated the 200-day EMA and 50% Fibonacci retracement, dropping the coin price to $53.
A shared support zone of $53 and 0.618 FIB level currently halts the bear attack and has triggered a retest to the 200-EMA. If the sellers could sustain the AVAX price below the $76 mark, the coin price would continue to drop lower.
The recent price jumps have brought a quick recovery in the RSI slope from the oversold zone. The slope has crossed above a resistance trendline and 14-SMA line, indicating a rising strength in coin buyers.
Bullish Opportunity Lies Above The $77.8 Mark

Source- Tradingview
The AVAX/USD pair resonates in an inverted flag pattern in the 4-hour time frame chart. This bearish continuation pattern could provide an excellent selling opportunity once the coin price fallout from the rising support trendline.
Conversely, the crypto traders can expect a reasonable recovery opportunity if the ALT price could breach the combined resistance of $77.8 and the 20-day EMA line.
The declining ADX slope shows losing selling momentum. However, a breakdown from the price pattern would initiate an upward swing.
- Resistance level- $77.8 and $91
- Support levels- $61 and $53


