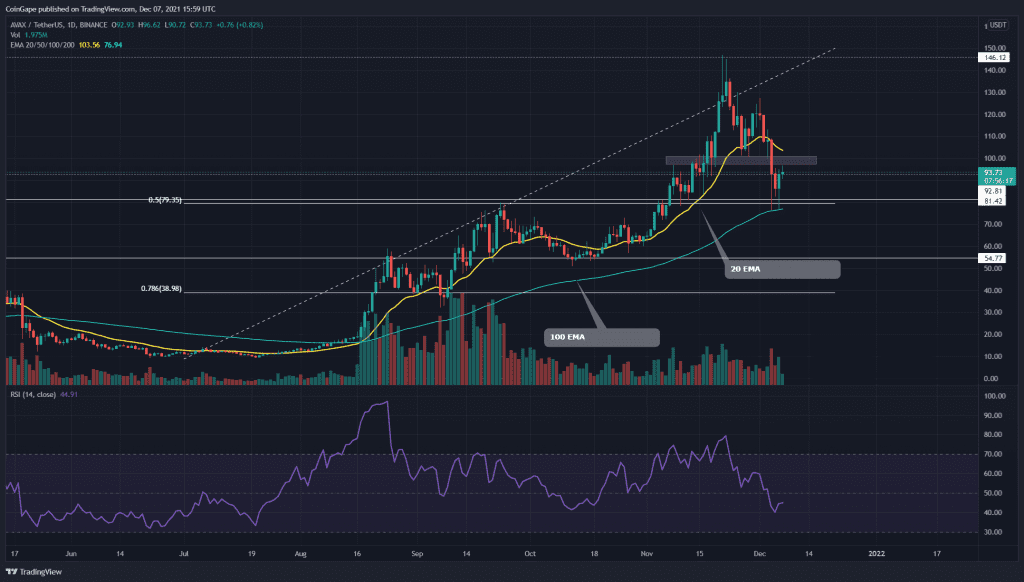
The AVAX token is trying to stabilize its price from the remarkable rally it initiated in august with a correction phase. Currently, the price is plunged to the crucial support of the $0.5 Fibonacci retracement level, which has the potential to continue the bulls rally.
Key technical points:
- The dynamic support 20-day EMA is flipped to the possible resistance level
- The intraday trading volume in the AVAX token is $1.37 Billion, indicating a 14.15%.
Source- AVAX/USD chart by Tradingview
The last time when we covered an article on AVAX/USD, The token price rally gave $146 as its New All-Time High on the technical chart. After a robust rejection from this new resistance, the token initiated a retracement phase, where he has lost 25% over the last two weeks. The token is currently sunk to 0.5 Fibonacci retracement level and indicates a high demand pressure through numerous lower price candles.
The crucial EMA levels(20, 50, 100, and 200) sustain a bullish mood for this token since its price is trading higher than the trend defining 100 AND 200 Ema. However, the dynamic support of the November rally 20 EMA is flipped to resistance.
The Relative Strength Index(44) shows a constant downward trend in the chart that is approaching the oversold zone.
AVAX/USD 4-hour Time Frame Chart

Source- AVAX/USD chart by Tradingview
The AVAX coin price showed an impressive V-shaped recovery after bouncing from the $80 support. However, the crypto traders should wait for the price to break out from this nearest resistance of $100 to get a better confirmation for the price to continue this rally.
According to the Fibonacci pivot levels, the crypto traders can expect the nearest resistance at $97, followed by $116. As for the opposite end, the support levels are $77 and $65.


