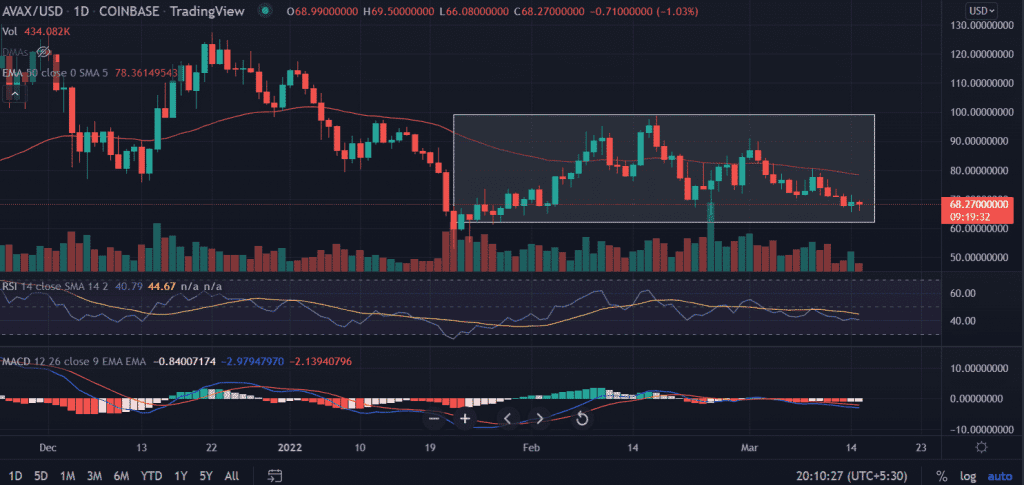
AVAX price edges lower with significant losses but in a relatively known trading range. The price makes consolidative moves for the second straight day. Investors seem indecisive near the vital support placed near $65.0.
- AVAX price is trading within a familiar trading range on Tuesday.
- Multiple support around $65.0 makes bulls hopeful for the next move.
- The momentum oscillator’s trade with negative bias warns of aggressive bids.
AVAX price lookout for bullish reversal
On the daily chart, AVAX price remains pressured below the 50-day critical 50-day EMA (Exponential Moving Average) at $78.0. however, the price is trading inside a ‘Rectangle’ formation since January 22. The highs are capped at the swing of $ 98.77 made on February 17.
Inside the formation, the price met the support zone around $65.0 two times and resulted in an ascent of 53% and 55% respectively. This time too, AVAX price is resting near the key level. We expect the price to bounce back to test the upside hurdle placed at $80.0.
If the buying pressure continues then bulls will jump toward the initial barrier of the moving average at $78.0. Next, market participants will take out the psychological $80.0 with ease as it marks the breach of the critical 50-day EMA.
An extended buying momentum will encourage buyers to revisit the highs of March 1 at $90.98.
On the flip side, a break of the session’s low will negate the bullish arguments. On the downside, AVAX’s price will meet the support at $62.0.
AVAX price is trading in a downside channel since November 22 after recording all-time highs at $145.25. As of publication, XRP/USD is trading at $68.24, down 1.10% for the day.
Technical indicators:
RSI: The daily Relative Strength Index makes lower highs and lower lows while trading below the average line.
MACD: The Moving Average Convergence Divergence is trading below the midline with a negative bias.


