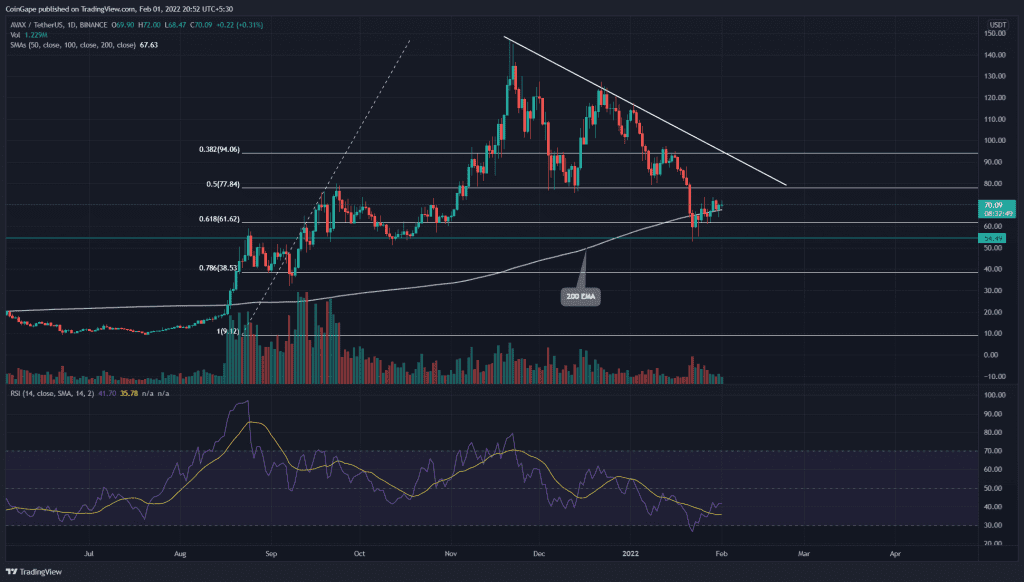
The recovery rally initiated last week has gained 33% from the current lower low of $53. The AVAX price approaches the $75 crucial resistance riding an inverted flag pattern. A bullish breakout from this resistance could signal a bullish rally.
Key technical points:
- The AVAX price chart shows a bearish crossover of the 50-and-100 SMA line
- The intraday trading volume in the AVAX coin is $78.5 Million, indicating an 18.5% gain
Source- Tradingview
As mentioned in our recent coverage on Avalanche (AVAX) price analysis, AVAX buyers lost the 0.5 Fibonacci retracement level in the recent crypto bloodbath and plummeted the alt to $53 level. The technical chart indicates a strong support zone at $60-$55, providing sufficient demand for the coin price.
The AVAX/USD chart shows an inverted flag pattern in the 4-hour time frame chart. The price action resonating in the pattern’s channel leads the current recovery rally. However, the buyers are facing stiff resistance at the $78 mark, maintaining an overall bearish sentiment.
The 50 and 100 SMA offer a bearish crossover in the daily chart, luring even more sellers to this coin. However, the recent price jump has reclaimed the 200 SMA, indicating the first win of recovery.
AVAX/USD In The 4-hour Time Frame Chart

Source- Tradingview
If bears reject the coin price from the $78 mark, the alt will slide to the immediate support zone at $60-$55. The bulls are likely to defend this zone, indicating the buyers are interested in this dip. A genuine breakout from overhead resistance($78) would be the first sign of the buyer’s strength.
The Moving average convergence divergence indicator shows the MACD and signal lines jump above the neutral sentiment(0.00), indicating a bullish momentum in the lower time frame chart.
- Resistance levels- $98.2, and $117
- Support levels-$86 and $79.2


