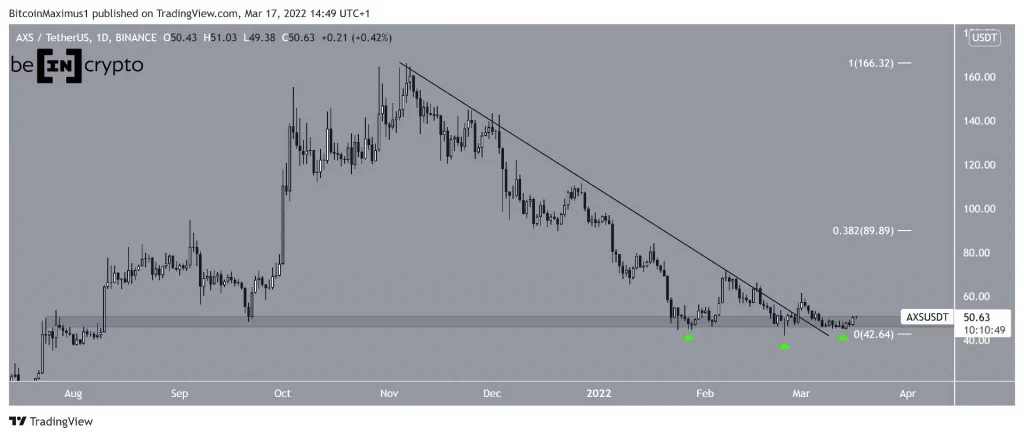
Axie Infinity (AXS) has broken out from a short-term descending resistance line, but is still trading below a more important, longer-term one.
AXS has been falling since reaching an all-time high price of $166.09 on Nov 6. The downward movement has been following a descending resistance line. This led to a low of $41.90 on Feb 24.
Initially, it seemed that this downward movement caused a breakdown from the $45-50 horizontal support area, which had been in place since Aug 2021. However, AXS quickly reversed trend and broke out from the descending resistance line on Feb 28.
Since then, it has returned to the $45-50 area once more, effectively creating a triple bottom pattern when looking at the price since Jan (green icons). The triple bottom is considered a bullish pattern which often precedes bullish trend reversals.
If one occurs, the closest resistance area would be at $90, created by the 0.382 Fib retracement resistance level.
Indicators support reversal
Technical indicators in the daily time-frame support the continuation of the AXS upward movement. This is visible in the bullish divergences that have developed in both the RSI and MACD.
Such divergences often precede significant bullish trend reversal. The fact that they are combined with a bullish pattern further increases their importance.
Furthermore, the six-hour chart shows that AXS has already broken out from a shorter-term descending resistance line. It is currently in the process of validating it as support. If it manages to clear the closest resistance area at $57, the rate of increase would be expected to accelerate.
The six-hour MACD and RSI support the continuation of this upward movement. Both are increasing, the former is positive while the latter is above 50 (green icons). All of these are considered signs of a bullish trend.
AXS wave count analysis
Cryptocurrency trader @CryptoTony_ tweeted an AXS chart, stating that the price could complete one final downward move before reversing trend.
There are two main possibilities for the wave count.
The first, as outlined in the tweet, suggests that AXS is in wave four of a five wave upward movement. In it, it will consolidate for a short period of time prior to a final drop.
Wave three is extremely elongated, and there is a disproportion between waves two and four (black).
The second possibility suggests that AXS has already completed its five wave downward movement. Therefore, it has now begun its trend reversal.
This possibility fits better with the triple bottom and considerable bullish divergences.
In any case, it seems that AXS is very close to a local bottom, if it has not reached it already.
For BeInCrypto’s latest Bitcoin (BTC) analysis, click here
Disclaimer
All the information contained on our website is published in good faith and for general information purposes only. Any action the reader takes upon the information found on our website is strictly at their own risk.


