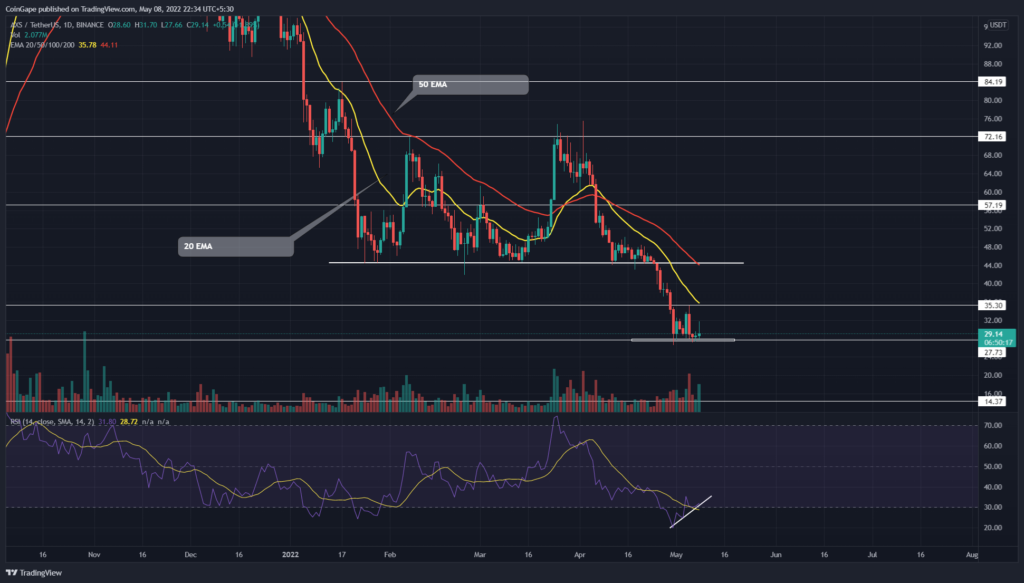
The Axie Infinity(AXS) price retests the $27 support twice within a fortnight. Moreover, an evident bullish divergence in the daily-RSI indicates the buying pressure at $27, encouraging the formation of a double bottom pattern. The bullish pattern should push the coin price above $35
Key points:
- The AXS price forms a double bottom pattern in the daily time frame chart
- The $27 fallout would invalidate the bullish thesis
- The intraday trading volume in AXS price is $454.1 Million, indicating a 114% gain.
Source- Tradingview
Following the January sell-off, Axie Infinity(AXS) price consolidated in a range-bound rally for the next three months. This range stretched from $44.5 to $72, reflecting a 60% gap from bottom to top.
However, amid the recent sell-off in the crypto market, the sellers poked the bottom support level on April 25th. The freefall devalued the AXS price by 35.6% and slumped the altcoin to $27 support.
Trending Stories
On May 5th, the AXS price went through a failed attempt to surpass the $35 resistance and plunged back to the $27 mark. However, a second bounce back from this support suggests the traders are quite interested in this dip.
The expected reversal would form a double bottom pattern and rechallenge the $35. A bullish breakout from this resistance would pump the AXS price 25% high to the $45 mark.
However, the $45 resistance is an important barrier for sellers, which simultaneously holds the key to a bullish recovery.
The Technical indicator
The daily-RSI slope escaped from the oversold territory and reclaimed the 14-SMA line. The long stretched bullish divergence bolsters the reversal theory from $27 support.
However, the trades should look after the 20-and-50-day EMA, aligned with $35 and $45 resistance, respectively. These EMAs strengthen the sellers’ defense and could interfere with the potential rally.
- Resistance levels- $2.65 and $3.3
- Support levels- $27 and $20


